Case study 1: Crystallization of trace components in natural gas
liquefaction process (LIQUEFINTM)
The continuous expansion of liquefied natural gas (LNG) trade for now more than three decades has been achieved thanks to the permanent search for cost reduction, mainly using the size effect. To pursue this expansion at the same sustained rate of up to 10 % percent per year, some operators are now seriously considering trains with capacities of 6, 7 or even 8 Mt/a. In order to reach such capacities, with always higher efficiency and without adding complexity in the process, it is necessary to depart from the traditional scheme. IFP and Axens have developed the LIQUEFINTM process with the aim of producing an LNG cheaper than with any other process, at good conditions of reliability and safety, and friendlier to environment.
Due to the increase of the world natural gas consumption, the distance between production and consumption sites is ever increasing. Pipeline transportation is not economical for these long distances and only liquid phase transportation is feasible. As a consequence, many high capacity gas liquefaction plants are presently in project.
In natural gas liquefaction processes, the gas feed is cooled to very low temperatures (113 K or 160 °C). The presence of traces of heavy hydrocarbons components in the liquefied natural gas (LNG) may therefore result in crystallization, and therefore plugging the installation. The present work investigates the vapour-liquid-solid equilibrium and proposes a way to predict the risks of crystallization.
In a first section, the process will be described to explain the different steps involved in the liquefaction of natural gas. The operating conditions will be specified in the crucial points of the process and a specific emphasis will be given on the risk of crystallization of heavy elements present in very low proportions.
In a second section, the three basic questions to be asked to give a correct answer to a thermodynamic problem will be analyzed:
- What are the properties given and to be calculated to obtain the solution?
- What are the components present in the mixture?
- What are the phases present in the different part of the process?
In a third part, in the light of the previous answers, a thermodynamic model will be developed. Here, a cubic EoS coupled with a Huron-Vidal mixing rule will be used. The choice of adequate experimental data will be discussed as well as the way to regress them.
The model will be applied at the different zones of the LIQUEFINTM process established as potentially risky operating conditions and some recommendations will be given for how to operate the process and how to enhance the model.
1 Process description
All processes for LNG productions are based on compression/expansion and heat exchangers. Some separation vessels and/or distillation columns are present in the process to satisfy commercial purities of products. An interesting comparison of different processes can be found in Martin et al. (2002 [1]) or in Mokhatab and Economides (2006 [2, 3]). The case study presented here is based on the LIQUEFINTM process sold by Axens.
The LIQUEFINTM process operates according to the basic flow scheme presented in figure 6-1. At the exit of the pre-cooling, the gas is scrubbed from its heavy end; the top is further refrigerated in the pre-cooling section and the condensate is used as scrubbing fluid. The vapour then enters the cryogenic section. The liquid (bottom) of the scrubber is introduced to a demethanizer to remove the heavy components that may represent a risk of crystallization. The head of the demethanizer is introduced in the cryogenic exchanger, reaching a temperature of 113 K.
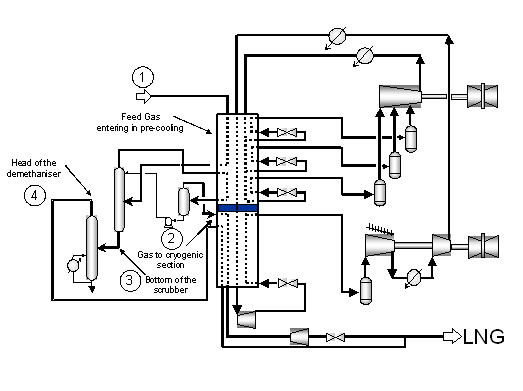 Figure 6-1: LIQUEFINTM general scheme.
The presence of traces of heavy compounds (mainly aromatics and cyclohexane) in the natural gas, associated to the very low temperature of the cryogenic process, create a distinct risk of plugging in the lines and the heat exchangers as a result of crystallization. This is the reason of the requested thermodynamic study.
2 Thermodynamic analysis of the process
According to the philosophy proposed in this book (see chapter 1), the analysis is centred on three main questions: properties, components and phases.
2.1 Properties
The main risk in the process, from a thermodynamic point of view, is the risk of plugging, i.e. to observe a solid to crystallize in the lines or in the exchangers. From a thermodynamic point of view, the phenomenon under consideration is a fluid-solid equilibrium. Yet, this crystallization is not wanted and, therefore, the true change in phase composition when large amounts of solids are formed (so-called flash calculation, as introduced in chapter 2, section 2.3.1.3) is not needed. Instead, the onset of crystallization, or the phase split boundary is the true quantity that is required here. The problem of phase boundary calculation has been discussed in section 2.3.2.4. of chapter 2: the most general approach is to investigate the tangent plane criterion using an algorithm as proposed by Michelsen [4]. Yet, as long as the precipitating phase can be considered as a pure component (which is the case in this work), it is sufficient to compare the fugacity (Gibbs energy) of that component in the precipitating phase (solid) with the fugacity of this component in the fluid phase. Whenever the fugacity in the precipitating phase is lower, then crystallization will occur. The algorithm is summarized in figure 6-2.
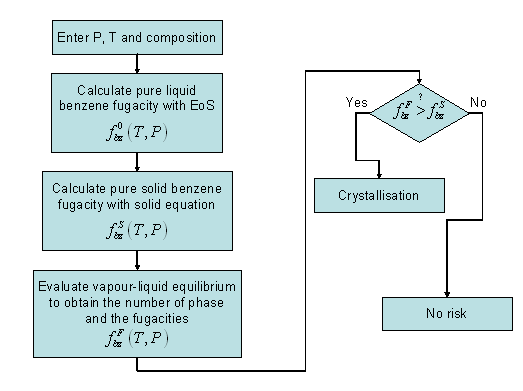 Figure 6 2: Phase border evaluation between liquid and solid.
It is concluded that in this analysis, a special attention will be given to the fugacity calculation of the components that may potentially crystallize.
2.2 Components
A typical feed for the process can be seen in table 6-1. All the components present in a natural gas are well known and belong to the type called "database components" in chapter 3, section 1.2.1. Subsequently, the crystallization temperature of all components can be found in databases. These are discussed in section 1.1.1.6 of chapter 3, and in table 6-2 of that section.
| Feed | |
|---|---|
| Component | Composition (molar %) |
| N2 | 4.91 |
| CH4 | 86.06 |
| C2 | 5.45 |
| C3 | 1.97 |
| iC4 | 0.36 |
| nC4 | 0.57 |
| iC5 | 0.21 |
| nC5 | 0.09 |
| nC6 | 0.12 |
| nC7 | 0.07 |
| nC8 | 0.04 |
| nC9 | 0.01 |
| CO2 | 0.01 |
| Benzene | 0.05 |
| Cyclohexane | 0.05 |
nCx stands for n-alkane with x atoms of carbon
| Triple point Temperature(K) | Triple point Pressure (Pa) | Enthalpy of fusion (J/kmol) | Volume of fusion (m3/kmol) | |
|---|---|---|---|---|
| Cyclohexane | 279.7 | 5.36E+03 | 2.74E+06 | 8.30E-03 |
| Benzene | 278.7 | 4.76E+03 | 9.87E+06 | 1.04E-02 |
| nC9 | 219.7 | 4.31E-01 | 1.55E+07 | 2.17E-02 |
| nC8 | 216.4 | 2.11E+00 | 2.07E+07 | 1.97E-02 |
| nC7 | 182.6 | 1.83E-01 | 1.41E+07 | 1.39E-02 |
| nC6 | 177.8 | 9.02E-01 | 1.31E+07 | 1.26E-02 |
The crystallization temperature of a number of pure components, from cyclohexane to n-C6 is lower than the process temperature (near 160 K). Nevertheless, the presence of other components in the mixture acts as a solvent and lowers the risk of crystallization. The fugacity calculation will give the definitive answer.
In this work, focus will be centred on benzene. Composition may vary with the gas in exploitation, but for risk analysis, it is good to take a composition that is rich in benzene and other heavy components. Some heavier components like decanes or xylenes or alkyl-cyclohexanes can be present but in so low quantities that the crystallization risks are neglected. Carbon dioxide may also be an issue as discussed by Eggeman and Chafin (2005 [5]).
As seen in table 6-1, the concentration of benzene in the feed is very low. As a result, the behaviour (activity) of this component is very different from that of the pure component (as discussed in chapter 3, section 4.1. In fact, it should be almost considered as an infinitely diluted component, and section 5.2.3 discussed how in these conditions, very specific data should be used (even mixture data should be considered with caution). The availability of the data will however lead to consider several types of information in the next section.
2.3 Phases
Initially, the feed is found as a vapour, directly produced from gas field. The objective of the process is to condense this vapour to facilitate transportation. Thus, a liquid is obtained as a result of the process. Due to the very low temperature of the cryogenic plant, some solid may appear as an anomalous behaviour. For this reason, study is concerned with three phases: vapour-liquid-solid equilibrium.
In chapter 4, fluid-solid equilibria of mixtures containing organic compounds was discussed in section 2.2.3.1. Pressure-temperature phase diagrams of multicomponent mixtures may become complex if solid phases are considered (Tiffin et al. 1979 [6]). Luks et al. (1981 [7], 1984 [8]) has classified the gas-liquid-solid phase diagrams into four types. Only the first type is of interest here, as it is the one encountered for the methane + benzene system. Its pressure-temperature projection is sketched in figure 6-3. For the light component, the vapour pressure line, the solidus line and the sublimation line are easily recognized. For the light component, only the vapour pressure line is drawn. The locus of critical points is visible as a doted line that connects the critical point of each of the pure components. In this diagram, this line is cut by two dashed lines that represent three-phase vapour-liquid-solid equilibria (VLSE).
The meaning of these curves is best understood when investigating a cut at constant pressure. An intermediate pressure (line P1 on figure 6-3), that is higher than the three phase points of either components, but lower than the critical point of both components (i.e., for the methane + benzene mixture, that yields that type of diagram, between 4.7 kPa and 4.6 MPa) is analyzed. In these conditions, the diagram sketched on figure 6-4) is found.
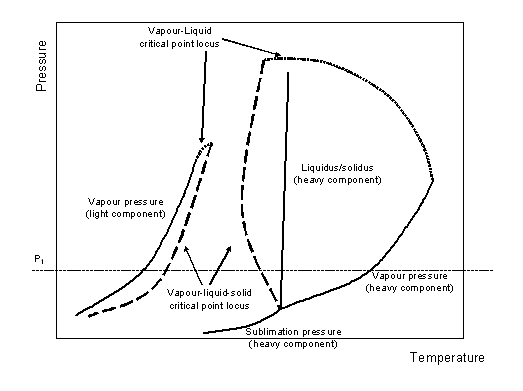 Figure 6-3: PT vapour-liquid-solid sketch for a methane + benzene mixture.
At high temperature, the mixture is always in the vapour phase. In a mixture rich in benzene (dotted line), the vapour-liquid equilibrium (VLE) region is first encountered upon cooling (dew point in figure 6-4). A liquid phase appears, that is richer in benzene than the vapour phase. If the initial mixture was sufficiently rich in benzene (doted-dashed line), the mixture may become entirely liquid (reach its bubble point) before forming a solid (point A). In this work, it is assumed that the heavy component always crystallizes as a pure component. This may not always be true, but it represents the highest risk of crystallizing at a given temperature. Cooling on the mixture, a three-phase line is reached before the mixture can become entirely liquid. This high temperature vapour-liquid-solid three phase equilibrium line (HT-VLSE) forms the limit below which the liquid crystallizes entirely: only a vapour and a solid phase coexist below this line. At still lower temperature, a second three-phase line is encountered, where the vapour condenses to form a liquid. The solid phase remains. This is the low temperature vapour-liquid-solid three phase equilibrium line (LT-VLSE).
Now, consider the case of a mixture with the composition shown as a dashed line, still richer in methane (which is the case in natural gas liquefaction processes). In this case, decreasing the temperature will result in crystallizing directly from the vapour phase (no HT-VLSE is encountered). So far, when the temperature is further lowered, the vapour will condense in a liquid phase, that has a higher capacity of dissolving the melt and, as a result, below the LT-VLSE three phase line, no crystal is left, but only a liquid and a vapour phase: this is the far left end of the regular vapour-liquid biphasic equilibrium region. The vapour keeps condensing upon further cooling until the bubble temperature, and eventually, at still lower temperature, benzene crystals (SLE) will appear again.
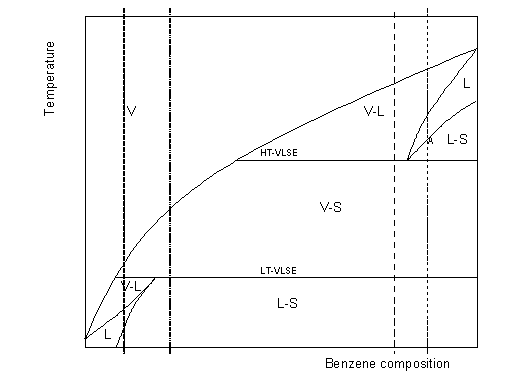 Figure 6-4: Txy vapour-liquid-solid sketch for a methane + benzene mixture.
3 Problem Solving Procedure
3.1 Evaluation of the most appropriate model
Models for the calculation of phase equilibrium are based on the fugacities: phase equilibrium is observed when the fugacities of each component in each phase are equal. A fugacity model is needed for each phase under consideration (see figure 6-2).
3.1.1 Fluid phase fugacity
As the mixture contains only hydrocarbons (see chapter 4, section 2.2), a wide choice of models is available for calculating these fugacities: activity coefficient models are generally not recommended for gases (not impossible, but more complex to use). Among the equations of state, the cubic equations are the most well-known, and will be used here. A cubic, Peng-Robinson [9] equation of state is selected here for calculating the liquid and vapour fugacities (chapter 3, section 4.3.4).
- The equation is used at very low temperature, in a region where very few data exist for model validation; and
- The component of interest is very diluted in a majority component that is methane.
As a result, special attention needs to be given to the mixing rule.
3.1.1.1 Selection of the α(T) function
The first step in parameterizing a cubic equation of state is to make sure that the pure component vapour pressures are correctly modelled using the selected α(T) function. The usual model is that of Soave, which is very acceptable for alkanes, but considering that the benzene properties will be extrapolated at very low temperatures, it was preferred to use the Twu equation [10] (see section 4.3.4.2, chapter 3):
3.1.1.2 Selection of the mixing rule
In order to be able to reach the infinite dilution properties of benzene, it is important to have a powerful mixing rule. In this work, it was chosen to use the mixing rule of Huron-Vidal (1979 [11]):
with, for the Peng-Robinson equation:
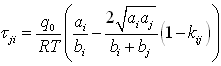
The excess Gibbs energy in equation (6-2) is expressed using a modified NRTL:
3.1.2 Solid phase fugacity
A solid phase appears if, for any of the components, the solid fugacity is lower than the fugacity of the equilibrium phase. This solid fugacity fS0, is calculated using the general thermodynamic relationships (see chapter 3, section 4.4.1).:
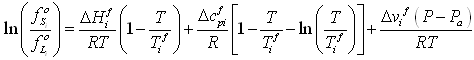
This equation expresses the change in Gibbs energy between the liquid and the solid phase, at the system pressure and temperature. On the left hand side, fL0 is the fluid phase fugacity of the pure component at the system temperature and pressure. It is calculated using the fluid state equation of state.
On the right hand side, the two first terms express the deviation due to the temperature difference between the fusion temperature and the system temperature. Usually, only the first term, that is proportional to the fusion enthalpy ( ΔHif ) is used. However, very large temperature deviations (more than 100 K) are considered, it is important to include the second term that takes into account that this fusion enthalpy varies with temperature. The proportionality factor is here Δcpif , the fusion heat capacity difference between solid and liquid. Finally, the third term of equation (6-5) is required when the system pressure differs from that at which the fusion properties are provided (which is usually atmospheric pressure). This last term is proportional to the volume of fusion, Δϒi . Both enthalpy of fusion and volume of fusion are available in databases (table 6-2).
3.2 Data required and data available
In order to construct a model it is essential to have experimental data, either for regressing parameters, or for validating the results. As it has been shown in the previous point the selected equation(s) require(s) parameters. These parameters may be physical properties, available in data bases, or will be regressed from experimental data.
3.2.1 Pure component data
3.2.1.1 Characteristic parameters
The chosen model (Peng-Robinson) requires the use of the critical parameters for every pure component of the mixture. Thanks to the fact that all components are database components, they can readily be found in the DIPPR database.
The solid fugacity model equation (6-5), in addition requires four more pure component properties: Tif, ΔHif, Δcpif and Δϒi. The two first are available too in the DIPPR database, but Δcpif will have to be determined. As a first approximation, the last parameter will be neglected (this Poynting-type correction affects the pressure dependence of the solid fugacity, which is generally small).
3.2.1.2 Temperature-dependent data
In order to parameterise the α(T) function (6-1), vapour pressure data are needed. Again, the DIPPR database provides an accurate correlation of vapour pressure for all components of interest in this work.
Finally, considering the low temperatures, and the fact that a fluid-solid equilibrium is considered, pure component sublimation pressures will be useful (see section 1.1.2.3 of chapter 3). This information is available too in the DIPPR database.
| Data needed | Data available |
|---|---|
| Critical temperature | In all common database and process simulators |
| Critical pressure | In all common database and process simulators |
| Acentric factor | In all common database and process simulators |
| Twu constants | Some published in original publication. Available in most simulators or fitted from vapour pressure |
| Fusion temperature | In most common database and process simulators |
| Fusion enthalpy | In most common database and process simulators |
| Heat capacity of fusion | Unavailable |
3.2.2 Mixture data
3.2.2.1 Fluid-solid equilibrium data
Since this work deals with crystallization of trace components from a gas mixture, it is essential to find data of the same kind that can validate the approach. After a careful literature search, following types of data could be identified (see table 6-4):
| Reference | Points number | Temperature range (K) | Data type |
|---|---|---|---|
| Kuebler,G.P.;McKinley,C. {Kuebler, 1974 2391 /id} | 39 | 99-200 | low temperature SLE |
| Neumann,A.;et al. [13] | 12 | 104-185 | low temperature SLE |
| Luks,K.D.;Hottovy,J.D.;Kohn,J.P.[7] | 23 | 165-278 | 2 SLVE lines |
| Rijkers,M.P.W.;Malais,M.;Peters,C.J.;De Swaan Arons, J.[14] | 100 | 262-298 | low and high temperature SLE + VSE + HT VLSE line |
Neumann et al. (1972 [13]) have measured benzene and cyclohexane crystallization out of methane. As it can be seen on figure 6 5, the risk of crystallization of benzene is greater than for cyclohexane, because at the same temperature, a lower composition of benzene can lead to solid precipitation. Yet, the temperature and concentrations do not fit with those of the process.
The data of Neumann et al. don't provide pressure information. This is a clear drawback in using them. Nevertheless, it can be considered that pressure has a negligible effect on phase equilibrium of condensed phases, as it is the case here.
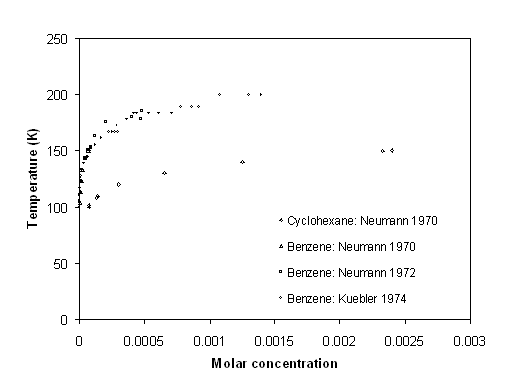 Figure 6-5: Crystallization of Cyclohexane and benzene in methane (data of Neumann et al. 1972 [13]).
It has been observed that the conditions that may be of interest to LNG processes are those where vapour-solid equilibrium (VSE) is encountered. Unfortunately, very few such data have been found. Only Rijkers et al. (1992 [14]) publishes such data, but for very high benzene concentrations (10% benzene).
The other information found in literature is given by Luks et al. [7]. They provide three-phase vapour-liquid-solid data. Two branches are observed on figure 6-6, one corresponding to the high temperature branch (HT-VLSE) and the other corresponding to the low temperature branch (LT-VLSE), information compatible with the description of figure 6 3.
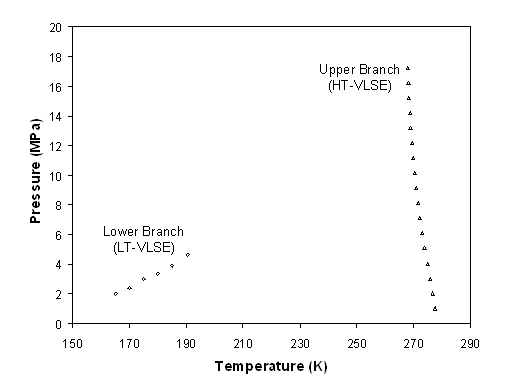 Figure 6-6: Pressure-Temperature projection of the methane + benzene three-phase lines, according to the data of Luks et al. (1981)
They provide as a function of temperature and pressure, the composition of the liquid phase. The graph of figure 6-6 clearly shows how the two three phase lines change with pressure. The lower three-phase line ends at the methane critical point. As a matter of fact, from that point onward, it becomes impossible to make the difference between the liquid and the vapour phase. The high temperature three-phase line continues until much higher pressures because the critical points locus of the methane + benzene mixture reaches high pressures.
3.2.2.2 Vapour-liquid equilibrium data
In order to determine parameters for the Huron-Vidal mixing rule, vapour-liquid equilibria are generally used. Most often, bubble pressures are regressed, and sometimes vapour composition, as discussed in chapter 3, section 3.
Methane (majority component) and benzene (crystallizing component) are the key components and will be focused on. Vapour-liquid equilibrium data for these mixtures exist, but at temperatures that are well above the process temperature. The lowest temperature data that were found originate from Rijkers et al. {Rijkers, 1992 1537 /id}, and cover eight different isotherms, between 270 and 330 K.
3.3 Parameters fitting
In order to use the model defined above, following parameters need to be determined:
- Twu's parameters for α(T) function to use with the PR EoS.
- Binary interaction parameters to use with the Huron-Vidal mixing rule.
- Heat capacity of fusion to use in the solid fugacity calculation.
3.3.1 Pure component parameters
The very first step is always to verify the pure component parameters of the equation of state. Use of validated critical parameters, and regression of the L, M, N parameters of equation (6-1) for each component of the mixture is a pre-requisite for the further analysis. In this work, no emphasis will be given to this first step.
3.3.2 Binary interaction coefficients
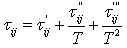
The choice of the Huron-Vidal mixing rule, that is based on the modified NRTL equation (6-4) results in three interaction parameters at any given temperature: αji, αij and σji. In addition, these parameters are a function of temperature:
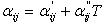
The strength of the Huron-Vidal mixing rule is that, when no data is available, an adequate choice of the interaction parameters is equivalent to a simple cubic mixing rule with κij: taking αij=0, it is possible to find:
On the other hand, when sufficient data exist, it is possible to regress them all in order to improve the accuracy of the calculations. In this work, focus will be centred on the methane + benzene binary mixture.
The binary interaction parameters (BIP) are generally fitted on vapour-liquid equilibria. In the case of the methane + benzene mixture, these data are abundant, but exist only at temperatures that are well above the process temperatures. The parameters available in the simulator that was used so far, were fitted on high temperature data. In this work, focus will be on data of Rijkers et al. as they go to 250K, the lowest of all isotherms known for that mixture. For comparison, a first set of BIP has been obtained with data that do not include the Rijkers et al. data set.
The deviation table 6-5 clearly shows that the first parameters were adapted to the high temperature conditions, but provide large deviations for the lower temperatures. The second set was adjusted on all data using following objective function:
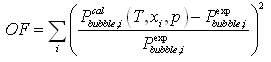
Rijkers et al. provide no data on the vapour composition, so that this could not be included in the regression.
| Data source (K) | parameters | κij=0 | |
|---|---|---|---|
| First set | Second set | ||
| 270 | 15.05% | 39.36% | 46.0 % |
| 280 | 8.91% | 32.20% | 39.0 % |
| 290 | 6.40% | 26.03% | 33.0 % |
| 300 | 6.94% | 21.28% | 27.0 % |
| 310 | 8.53% | 17.13% | 23.0 % |
| 320 | 11.00% | 14.11% | 19.0 % |
| 330 | 11.18% | 10.86% | 16.0 % |
| 340 | 12.30% | 7.41% | 15.0 % |
3.3.3 Heat capacity of fusion
The parameters of the solid fugacity function, equation (6-5), are all known quantities ( ΔHif J/mol and Δϒif m3/mol) except the heat capacity of fusion ΔCpif. As a first approximation, it is possible to assume it is negligible.
In order to validate this approach, the first step is to evaluate the pure component fluid solid equilibrium line, i.e. the sublimation line. Doing so, and assuming that the vapour fugacity equals the partial pressure:
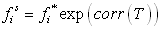
where 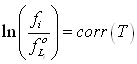 is the right hand-side of equation (6-5) without the Poyinting correction term (pressure is low and this term is very small).
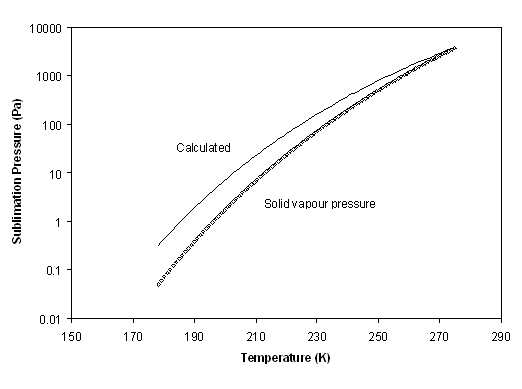 Figure 6-7: Evaluation of the correction term (equation (6-10)) as a function of temperature for benzene crystallization.
Figure 6-7 shows the result of this calculation. Obviously, at the triple point, all fugacities are equal (this is so by construction of equation (6-5), but it is clear that at low temperature, the benzene sublimation pressure deviates from the simplified model. Correction term can not be neglected. It can be concluded that the solid heat capacity upon freezing, ΔCpif, will need to be fitted. Considering the expressions used, the correction term has been chosen in the objective function:
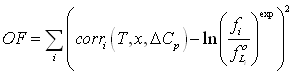
Indeed, it is rather easy to calculate the experimental value of ln(fi / fL0) by observing that when crystallization occurs, fi = fS0 , where fi is the fugacity of component i in the stable phase (calculated using the equation of state at the experimental temperature, pressure and composition), while is calculated using the same equation of state, for pure benzene at in the liquid phase at the same temperature and pressure.
In addition to the pure component sublimation pressure, it is possible to consider the mixture LSE data by Neumann et al., It is essential to reproduce correctly these latter data since the temperature and concentration conditions are close to the process conditions. Figure 6 8 shows the logarithm of the fugacity ratio for the two types of solid equilibrium data. It is clearly visible that the two curves are not co-linear. The reason for this is most probably due to the imperfections of the Huron-Vidal mixing rule that is used. When sublimation data are used, no mixing rule is needed, as all data concern the pure component. On the opposite, the low temperature LSE data concern very small benzene concentrations in almost pure methane. Hence, in the latter case, the infinite dilution fugacity is used, which is extrapolated from the equation that has been validated on high temperature VLE data.
Yet, in the present study, attention has been focused on the low temperature and high dilution behaviour. Doing so for benzene, it has been found, with a few trial and error, the value of ΔCpif = -200 kJ/(kmol.K).
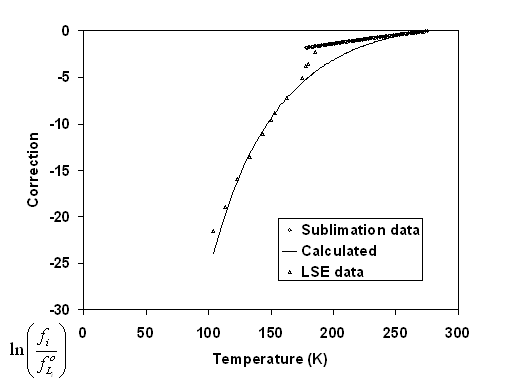 Figure 6-8: Correction term (equation (6-5)) as a function of temperature for benzene crystallization. The diamonds refer to sublimation data; the triangles to benzene crystallization in methane.
3.4 Model validation
First at all, it is important to check the validity of the solidification model. Evolution of both fugacities (the benzene solid fugacity and the benzene fluid fugacity in the mixture calculated with EoS) is compared as a function of temperature. When fugacities are the same, a fluid solid equilibrium is expected. It can be appreciated in figure 6-9 that this model predicts correctly the three cases shown in figure 6-4 (the dashed line at low benzene composition).
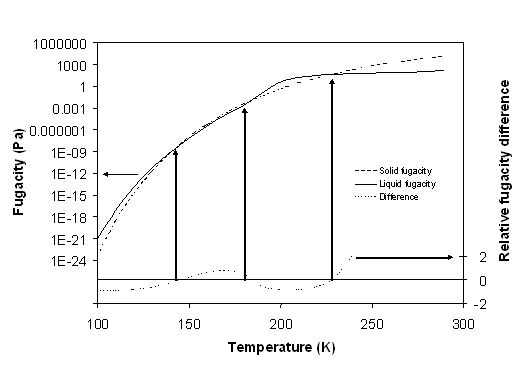 Figure 6-9: Correction term (equation (6-5)) as a function of temperature for benzene crystallization. The diamonds refer to sublimation data; the triangles to benzene crystallization in methane.
The model that is thus developed has been first validated by extrapolation of pressure and temperature conditions, using the data of Rijkers et al. (1992) as shown in figure 6-10. This plot shows two distinct types of behaviour. At higher temperatures, and high concentrations of benzene, LSE lines are seen. The data points and the model (line) agree within 5 K. The model over-predicts crystallization temperatures which is acceptable for a safe design. At lower temperature, a vapour-solid equilibrium line is shown. Again, the model qualitatively agrees with the data. The crystallization temperature increases while pressure decreases. At lower pressures (process conditions), it is expected to over-predict the crystallization temperature, again a safe result. Unfortunately, no data could be found showing crystallization from the vapour phase at benzene concentrations that are closer to the process conditions (less than 1 %).
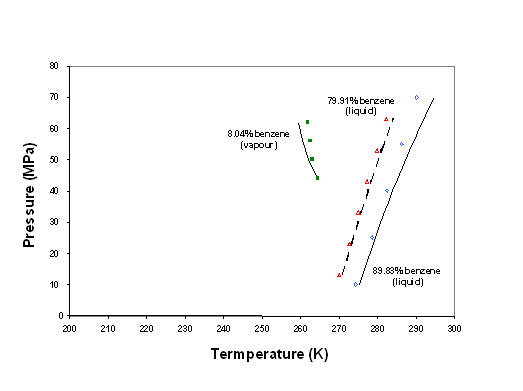 Figure 6-10: Model validation on the benzene crystallization data out of methane of Rijkers et al. (1992).
4 Application to process analysis
As mentioned previously, four different points have been selected for analyzing the risk of crystallization. The feed to LNG process is of course of main importance due to the presence of the higher content in heavy components. Other critical flows are those of the cryogenic section of the exchanger at the lower temperature of the process. Two different flows, with similar composition, are analysed: the head of demethanizer and the LNG product available at the top of the vessel. Finally, the bottom of the scrubber has very different composition and is analyzed too. The composition of the different currents is summarized in table 6-6.
| Component | Feed Composition (molar %) | Head of demethanizer Composition (molar %) |
|---|---|---|
| N2 | 5 | 1.64 |
| CH4 | 86 | 91.66 |
| C2 | 5 | 5.71 |
| C3 | 2 | 0.96 |
| iC4 | 0.5 | 0.01 |
| nC4 | 0.8 | |
| iC5 | 0.1 | |
| nC5 | 0.3 | |
| nC6 | 0.1 | |
| nC7 | 0.06 | |
| nC8 | 0.02 | |
| nC9 | 0.01 | |
| CO2 | 0.01 | 0.02 |
| Benzene | 0.05 | 10 ppm |
| Cyclohexane | 0.05 |
4.1 Feed crystallization phase diagram
Using the feed composition given in table 6-1, figure 6-11 shows the crystallization of benzene at different temperature-pressure conditions. The vapour-liquid (V-L) phase envelope is predicted. There is a clear risk below -90°C, but pressure has an effect as well:
When pressure is very low (atmospheric), solid appears much earlier (i.e. at higher temperature). This can be explained rather easily by observing that in these conditions, the liquid phase is rather concentrated in benzene.
In the liquid region, it is seen that increasing pressure results in a higher solubility of the solid. This is because this liquid phase remains somewhat compressible as it is essentially composed of methane, and therefore the temperature is close to the critical temperature. Hence, at higher pressure, the liquid is denser which means it is a better solvent for the benzene crystals. Note that the phenomenon had been opposite if the liquid had been less compressible, as is the case with pure benzene: the higher the pressure, the larger the tendency to form a solid phase.
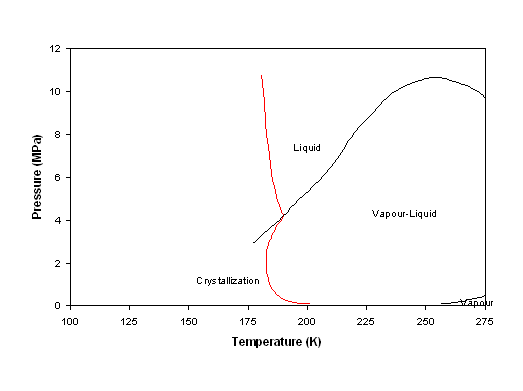 Figure 6-11: Phase diagram of the feed, given in table 6-1. L-V means vapour-liquid; F means fluid phase. When 'S' is included, benzene is crystallized.
4.2 Demethanizer diagram
A typical composition of the head of the demethanizer is shown in table 6-6. For this exercise, Benzene specification in the demethanizer and the LNG product overhead have been relaxed to 10 ppm instead of the generally considered 1 ppm.
The corresponding phase diagrams are presented in figure 6-6.
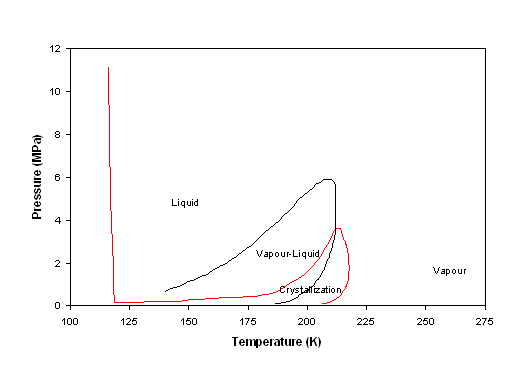 Figure 6-12: Phase diagram of the head of the demethanizer with 10 ppm of benzene (as shown in table 6-6.
This figure 6-12 again shows the vapour-liquid equilibrium zone as 'L-V', and the single phase region as 'F'. Three different crystallization zones can be identified:
- Below 115 K benzene crystallizes from the liquid phase.
- In the same way as in the feed, benzene crystallization can be observed at low pressure within the vapour-liquid zone. In opposition with what is seen in figure 6-11, the fluid is very rich in methane, and as a result the vapour zone, below the vapour-liquid equilibrium, is visible. In this zone, where the fluid is single phase vapour, crystallization also occurs, at rather high temperatures (up to 200 K), even though the benzene concentration is as small as 10 ppm molar.
This last crystallization zone can be explained when considering the Txy sketch of 6-4. It was explained how, at a fixed pressure, a first crystallization zone from the vapour phase could be observed at moderate temperature. When temperature decreases, the crystals dissolve in the liquid that appears. The crystals reappear at much lower temperature, out of the liquid methane.
Unfortunately, no experimental data illustrating this behaviour could be found.
5 Conclusions
This work was executed in order to evaluate the risk of benzene crystallization in the LIQUEFINTM gas liquefaction process. The work is presented in three stages:
- In order to understand the physical phenomenon of crystallization, the phase diagram of the methane + benzene binary system is first investigated in detail. It is shown that two liquid-solid and one vapour-solid equilibrium zones exist, in addition to the well-known vapour-liquid equilibrium.
- In a second stage, a thermodynamic model is developed, that uses the Peng-Robinson equation of state with the Huron-Vidal Mixing rule. The parameters for this model have been determined based on high temperature VLE data. It is obvious that the model is used at temperatures that are well below the temperature of the data used. Hence, care has been taken that the extrapolation to lower temperatures is as acceptable as possible. An additional parameter (fusion heat capacity) is determined using low temperature LSE data.
- In a final stage, the model is used to calculate the phase diagram of two typical compositions encountered in the LIQUEFINTM process. The first composition is rich in heavy end components. As a result, a liquid phase is always present. This liquid may be concentrated in benzene, which increases the crystallization risk at higher temperatures and low pressures. The second composition is very pure methane. As a result, a single vapour phase may exist at high temperature and low pressure. Even though the benzene concentration is very small in this context (10 ppm molar), a crystallization risk from the vapour phase exists which justify the choice for a lower benzene specification in the demethanizer overhead. This phenomenon is of importance for the design of the LNG process, but no experimental data validating this behaviour has been found.