mCSEM > Back to theory
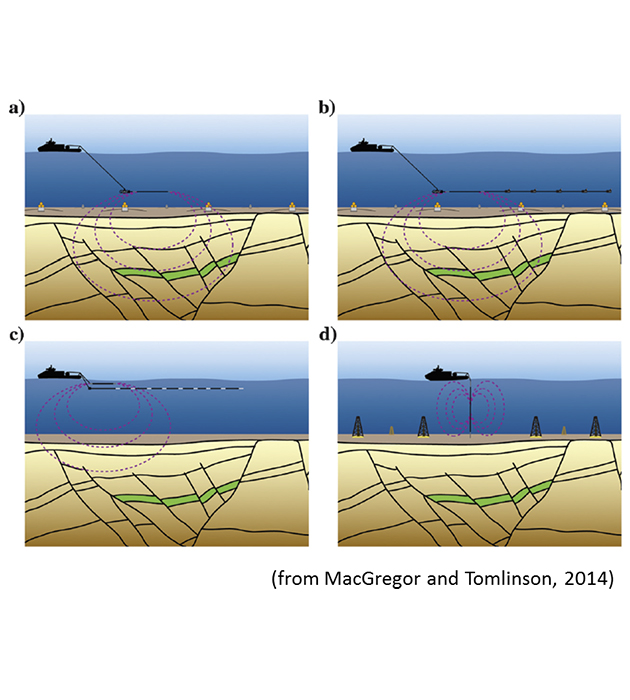
  • Step 1: Various mCSEM acquisition strategies
    • a: The most commonly applied form uses a high-powered horizontal electric dipole (HED) source to transmit a low-frequency electro-magnetic (EM) signal through the seafloor. The source is towed at about 30m above the seafloor. Receivers are deployed on the seafloor at the start of a survey and log autonomously. They record at least the horizontal components of the Electromagnetic field. Resistivity of the earth can be determined at scales of a few tens of meters to depths of about 3km below mudline.
    • b: Three components electric field receivers are towed at offsets up to 1 km behind a horizontal electric dipole source, close to the seafloor. It is applicable to the mapping of resistivity in the shallow subsurface.
    • c: Comparable to (b) but towing only inline horizontal electric dipole receivers (parallel to the HED source) at offset up to 8 kilometers and around 10m to 100m below the sea surface. It is an efficient way to acquire inline only EM data, but in water depth shallower than 400m.
    • d: Source and receivers are vertical electric dipoles. If the acquisition apparatus can be complicated and less efficient than C for instance, it has the potential to improve lateral resolution of subseafloor resistivity structure.

  • Step 2: Diffusion signature for plane signal approximation in homogeneous medium
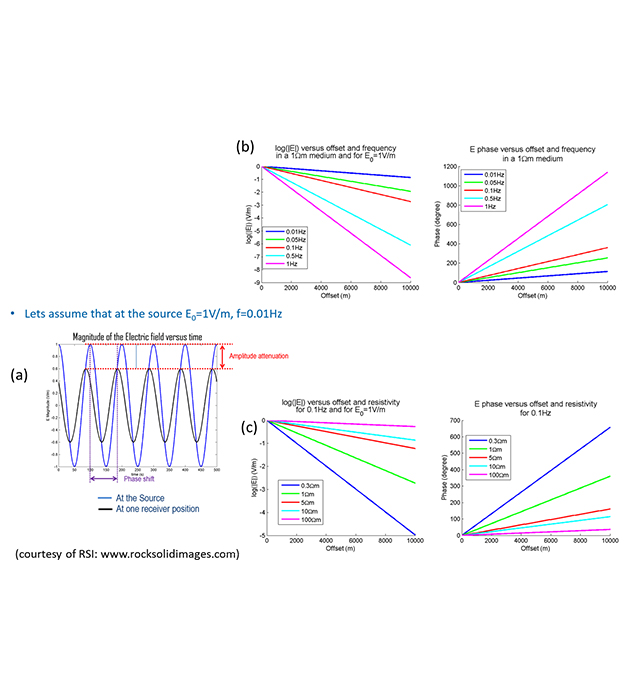
    • If the source emits a monochromatic signal, in the plane signal approximation the signature of the medium is to:
      • attenuate the amplitude
      • delay the phase of the signal.
    • Such distortions are recorded by the receivers and are fully describes in the frequency domain: Amplitude and Phase.
    • In the frequency domain, when analyzing the signal versus the offset (distance in between source and receiver), the higher the frequency:
      • the more attenuated the amplitude
      • the more retarded the phase
    • For a given frequency, the higher the resistivity:
      • the less attenuation in the amplitude
      • the more advanced the phase.
      Given that the source is fully controlled, by assessing the amplitude and phase curves slopes, the resistivity of the medium can be derived.

  • Step 3: Signal complexity
    In reality, geometric galvanic and diffusive effects are combined. In addition, source and receivers are coupled, not only to the earth (relatively resistive) but to the sea (very conductive) and air (extremely resistive) as well (Andreis D. et la, 2008). The signal can be quite complex, thereby requiring powerful forward and inversion algorithms to interpret the data.

  • Step 4: Influence of geometry on the response for a HED source
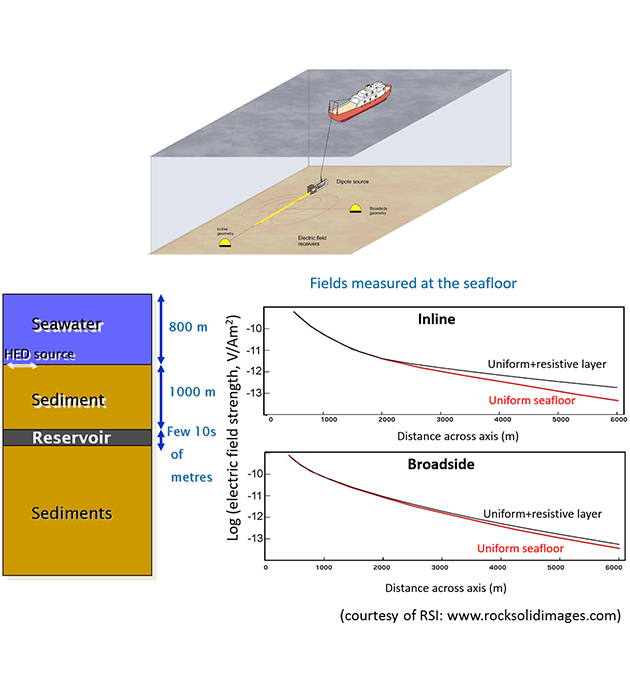
    2 end member geometries can be distinguished. The inline geometry, for which the receiver is aligned with the dipole. And the broadside geometry, for which receiver position with respect to the source and source orientation, are 90 degrees to each other.
    In the former geometry, vertical current loops are mainly coupling source and receiver, thereby coupling the signal more with the TM mode. The current is forced to cross the thin resistive reservoir, leading to a strong galvanic signature in the signal. In the latter geometry, horizontal current loops are mainly coupling source and receiver, thereby coupling the signal more with the TE mode. Due to the strong reservoir resistivity, poor induction leads to poor signature in the signal. To summarize, if inline geometry is extremely sensitive to thin resistor, broadside geometry is not.
    It must be noted that such geometries affect the constraining of the earth anisotropy too. Inline geometry is sensitive to both horizontal and vertical resistivities (vertical current loops), when broadside geometry is mainly sensitive to horizontal resistivity (horizontal currently loops) (Ramananjaona et al, 2011).

  • Step 5: Sensitivity to target resistivity/thickness
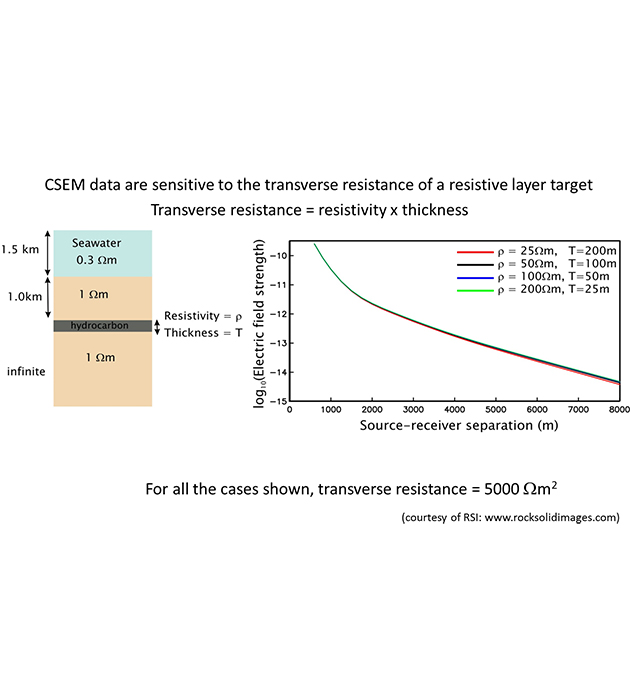
    mCSEM data are sensitive to resistivity but more precisely to transverse resistance. Transverse resistance is defined as the integrated resistivity along the z axis. In other words, it is the product in between resistivity and respective thickness. Up to a certain limit, different geological layers (thin or thick, resistive or conductive respectively), but with the same transverse resistance, can have the same mCSEM signature. Such behavior is paramount when interpreting mCSEM data.

  • Step 6: Physical effects wrap up
    Electric and magnetic field receivers are deployed to record time-series measurements of the fields, like with MT measurements. These instruments also receive signals emitted by a towed CSEM transmitter at ranges up to 10 km. The CSEM signals involve both vertical and horizontal current flow, which could be interrupted by oil or gas reservoirs (green layer on the sketch) to provide sensitivity to these geologic structures even when they are quite thin, with Geometric, Galvanic and Inductive effects at stake. Occurrence and predominance of effects depending on geology and source-receivers offsets. On the chart, yellow zone is dominated by Inductive and Geometric effects; red zone is dominated by Galvanic and Geometric effects; green zone is dominated by Geometric effect.

  • Step 7: Some take-home points