Chapter 4:
From Phases to Method (Models) Selection
Abstract
Read the abstractTable of contents
See the table of contentsList of examples
- 4-1: Calculation of the condensation enthalpy of the acetone + water mixture with NRTL at a given pressure (1 bar)
- 4-2: Distribution coefficients in an ideal mixture (propane + n-pentane)
- 4-3: Comparison of phase envelope predictions for the ethane + n-pentane mixture
- 4-4: Behaviour of a methane + n-decane mixture and its models
- 4-5: Behaviour of the benzene + n-hexane mixture and its models
- 4-6: Calculation of the eutectic of para- and ortho-xylene
- 4-7: Comparison of experimental values and different model with H2 + n-hexane mixture
- 4-8: Prediction of a heteroazeotrope with total liquid immiscibility
- 4-9: Formation of hydrates
- 4-10: Example of a vapour-liquid-liquid equilibrium of an acid gas system in the presence of water
- 4-11: VLE and LLE calculation of the methanol + n-hexane mixture
Example 4-4: Behaviour of a methane + n-decane mixture and its models
Experimental values of vapour-liquid equilibrium of methane+ n-decane mixture are available from Lin et al. (1979)[1]. The large difference in molecule size results in an asymmetric mixture with entropic deviation from ideality. In addition, since methane is largely supercritical, a critical point appears at intermediate concentration.
As shown on figure 1, the bubble points (solid dots) and the dew points (empty dots) show a large gap between both curves, indicating the experimental difficulty in locating the critical point. The Peng-Robinson model with BIP equal to zero can adequately predict the dew curve, although it excessively under-predicts the bubble curve. With the BIP predicted by the Kordas et al. method, the bubble line is better fitted with a small loss of precision for the dew line. The Jaubert et al. predictive method PPR78 is even better for the bubble line but is worse for the dew line representation.
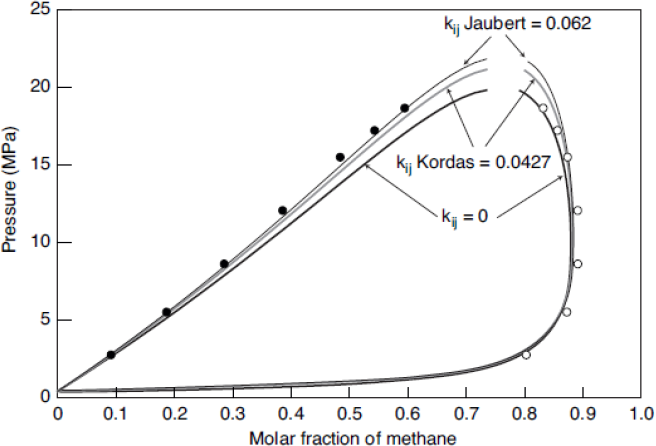 Figure 1: Phase envelope of methane + decane equilibrium (experimental and models) at 510.95 K.
References
[1] LIN H.M., SEBASTIAN H.M., SIMNICK J.J., CHAO K.C., Gas-liquid equilibrium in binary mixtures of methane with N-decane, benzene, and toluene, Journal of Chemical & Engineering Data, 1979, 24, n°2, p. 146-149. http://dx.doi.org/10.1021/je60081a004