-
Step 1: Coherency fundamentals.
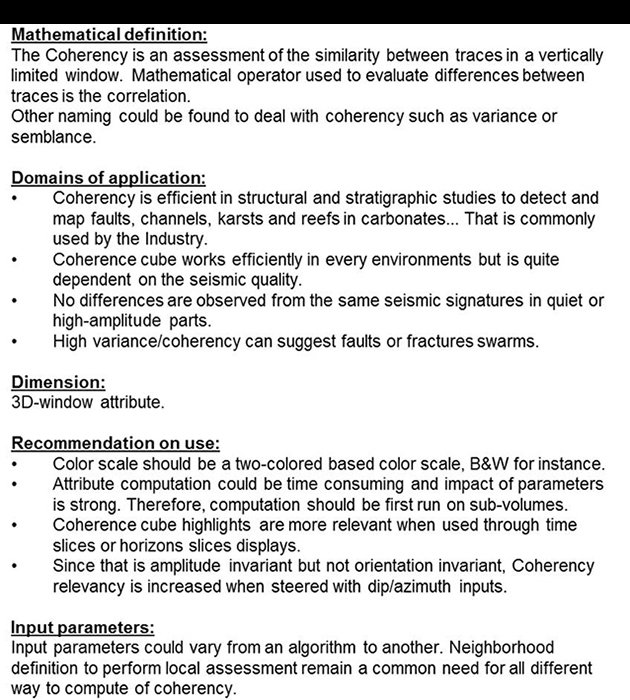
The opposite panel gives an overview of the attribute characteristics.
Coherency computation relies on "correlation" also named "cross-correlation" operator in a defined neighborhood along the three dimension of space.
-
Step 2: Case Study Overview.
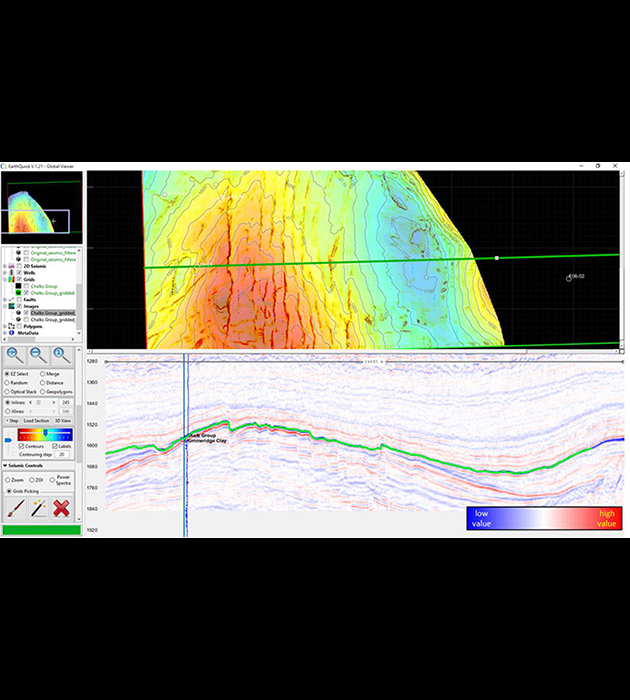
Discussion only focuses on signal processing matters. Interpretation or geological concepts are not developed in the example, even though the current case exhibits ability of Coherency to help with faults network mapping.
The seismic data is extracted from post-stack time migrated 3D seismic data (Netherlands, F3 Block).
- Upper panel shows the map of an interpreted horizon (Top Chalk) overlapped by the Coherency attribute extracted along the latter horizon to highlight the fault network.
- Lower panel shows the inline section 245 of the reflected amplitudes. It is located by a dark green line on the base map. Top Chalk horizon is represented as a light green picking.
-
Step 3: Coherency attribute in a 3D view.
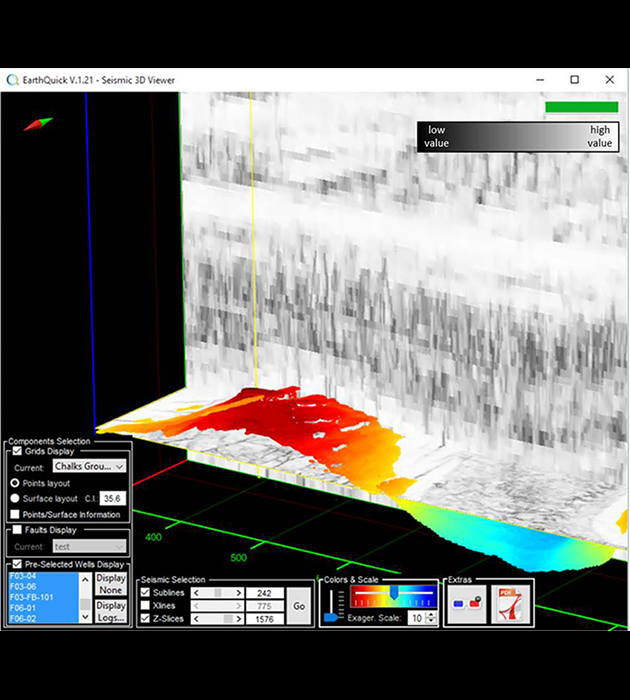
Inline section 245 and 1576-ms time slice of the Coherency attribute are displayed. The same interpreted horizon as in step 1 has also been added.
That rendering helps to figure out Coherency is intrinsically not adapted to displays along vertical sections.
-
Step 4: Horizon slice with the Dip attribute.
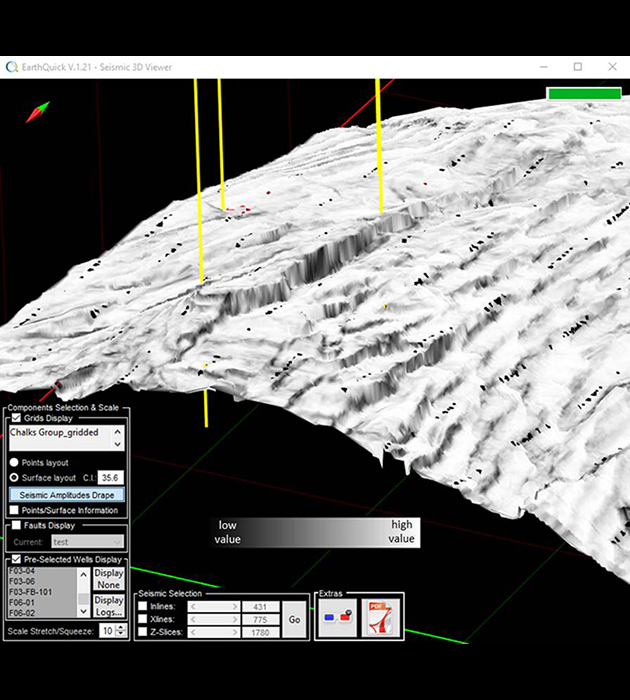
Coherency is extracted and draped over the horizon. Lateral discontinuities are revealed by blacks (low coherency values). They are mainly distributed along the faults.
As a general rule, preferential display mode for Coherency remains time slices and horizon slices.
Acknowledgements:
The example is made of Post-stack time migrated 3D seismic data (Netherlands, F3 Block) provided by dGB Earth Sciences through OpendTect share seismic data repository. Netherlands Government is kindly acknowledged for making data public if dedicated to academic purposes.


