Update Required
To play the media you will need to either update your browser to a recent version or update your
Flash plugin.
Update Required
To play the media you will need to either update your browser to a recent version or update your
Flash plugin.
A processing based on Singular Value Decomposition is done on the 2 constant offset sections independently, in a 5 traces depth running window. SVD is used to divide the data into eigensections. Each eigensection is built from an eigenvalue and two normalized eigenvectors :
- a singular vector giving the relative amplitude in depth, hence named propagation vector;
- a singular vector giving the time dependence, hence named normalized wavelet.
-
Step 1: Example of Singular Value Decomposition
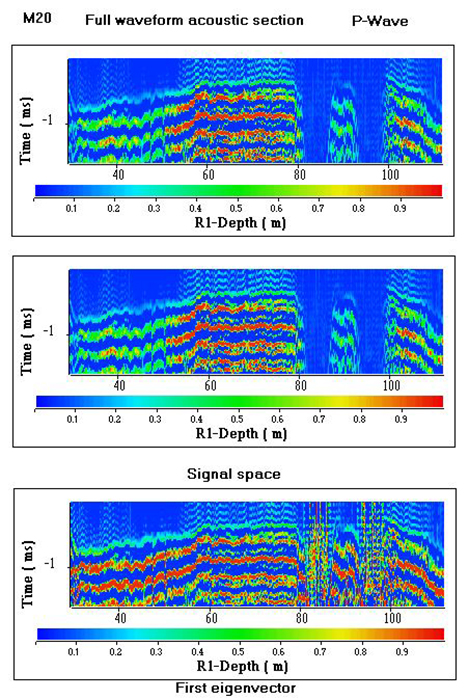
Figure shows the results obtained with the 3 m constant offset section. SVD is done in the time interval associated with the refracted P-wave. We can see from top to bottom:
- the raw section;
- the signal space. It is the first eigensection with the highest eigenvalue;
- the first eigenvector giving the time dependence. It is the normalized wavelet.
-
Step 2: Velocity computation.
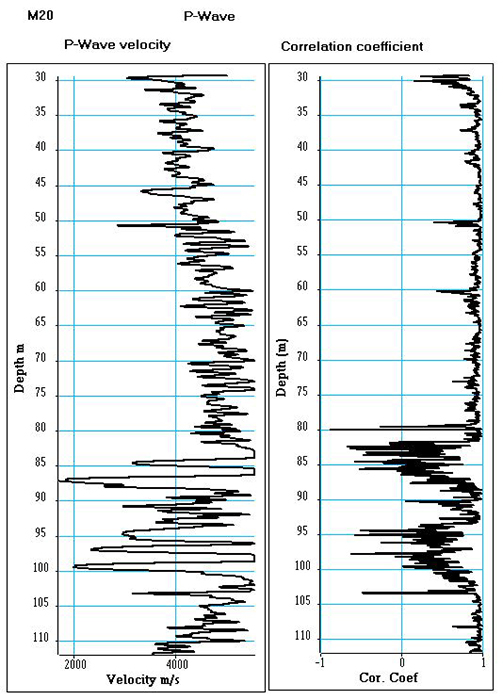
The minimization of a cost function based on the normalized wavelets extracted from the two constant offset sections allows for computing simultaneously the velocity V of the formation and the correlation coefficient between the wavelets. We assume that between the two normalized wavelets there is only a time shift which gives the velocity of the formation.
Figure shows the velocity log and its associated correlation log. We observe high values of the correlation coefficient, except for two depth intervals between 82 and 88 meters and between 95 and 100 meters.
-
Step 3: Amplitude computation.
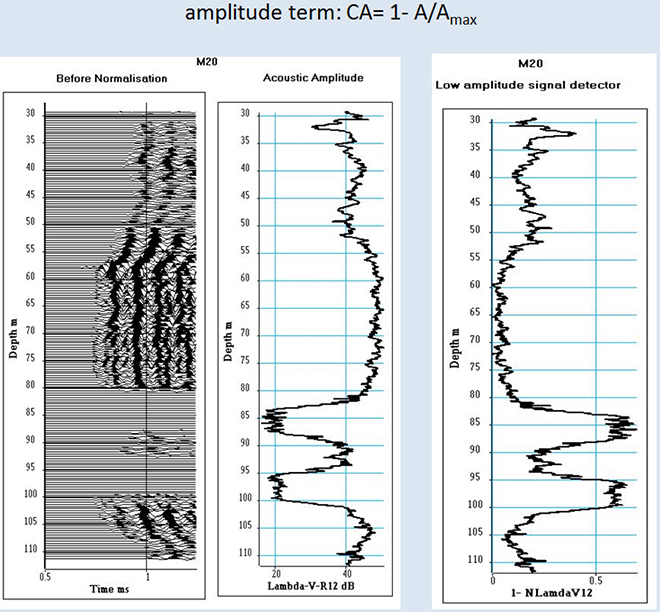
The product of the first eigenvalue by the propagation vector gives the amplitude variation of the acoustic signal versus depth.
Figure shows from left to right the signal space of the acoustic section, the acoustic amplitude and a log named low amplitude signal detector. The log is high when the amplitude of the acoustic signal is low, as it can be seen in the two depth intervals between 82 and 88 meters and between 95 and 100 meters.


