Update Required
To play the media you will need to either update your browser to a recent version or update your
Flash plugin.
Update Required
To play the media you will need to either update your browser to a recent version or update your
Flash plugin.
Each shot point (both in the cross line direction and in the in line direction) has been processed independently to obtain a single fold section. The processing sequence includes: amplitude recovery, deconvolution, wave separation (SVD method for extracting refracted waves and combination of SVD and F-K methods for filtering surface waves) , static corrections (obtained by inversion tomography) and normal move-out corrections. VSP data have been processed to obtain a time versus depth relationship and a velocity model. The velocity model has been used to apply the normal move-out corrections.
-
Step 1: Tomographic inversion.
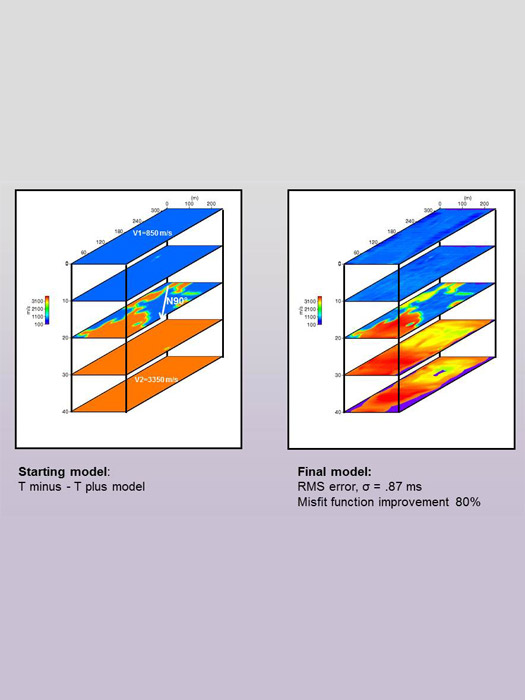
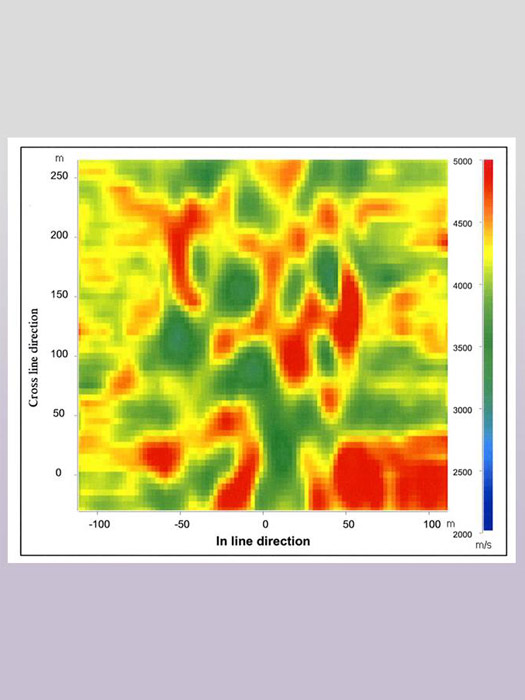
A 3D Refraction seismic surveying has been used to map the irregular shape of the top of karstic reservoir and to obtain by tomography a velocity model of the overburden. The tomography is based on the first arrival picked times of all the shot points. Figure shows the results of the 3D tomographic inversion stopped when the rms error reaches a value around 0.87 ms, with an improvement of about 80 % during the optimization procedure. Figure also shows the velocity distribution at different depths ( 0, 10, 20, 30 and 40 m).
-
Step 2: Seismic sections in time and depth.
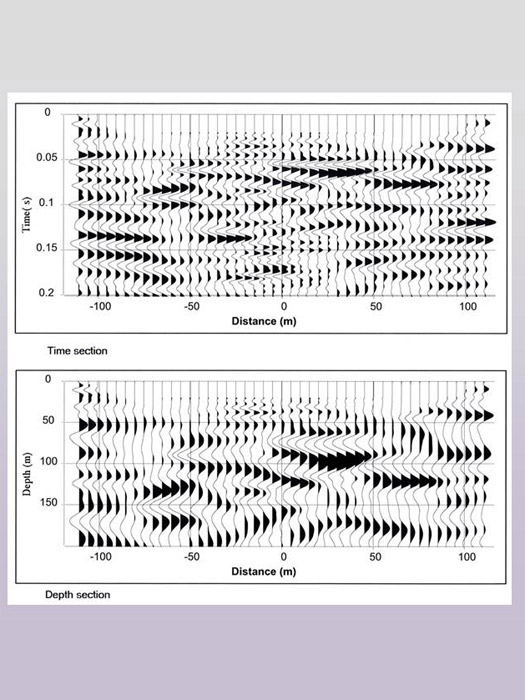
The VSP time versus depth law has also been used to convert the time sections into depth sections. The single fold depth sections have been merged to create the 3D block. Figure shows the results obtained for the in line 31 seismic section.
-
Step 3: Pseudo velocity depth section.
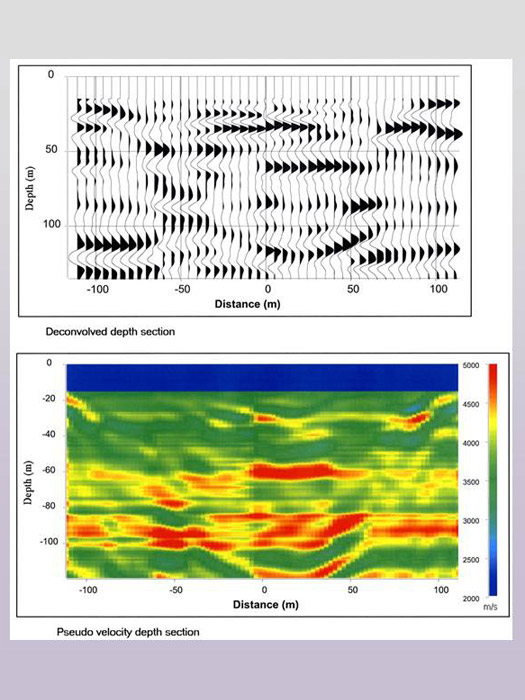
The depth sections have been deconvolved in order to increase the vertical resolution. They have been then integrated with respect to depth to transform an amplitude block into a 3D pseudo velocity block in depth, using velocity functions as constraints. The velocity functions are computed from acoustic logs recorded in 5 wells situated in the area. Figure shows the results obtained for the in line 31 seismic section.
-
Step 4: Composite pseudo velocity depth section.
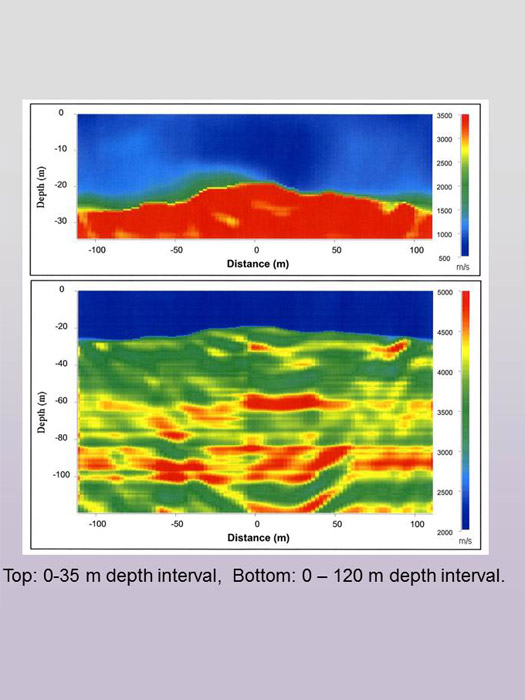
The pseudo velocity sections of the 3D block thus obtained have been merged with those obtained by refraction tomography to create a 3D extended velocity model from the surface. Figure shows the results obtained for the in line 31 seismic section.
-
Step 5: Pseudo velocity depth map at 87 m depth.


