Update Required
To play the media you will need to either update your browser to a recent version or update your
Flash plugin.
Update Required
To play the media you will need to either update your browser to a recent version or update your
Flash plugin.
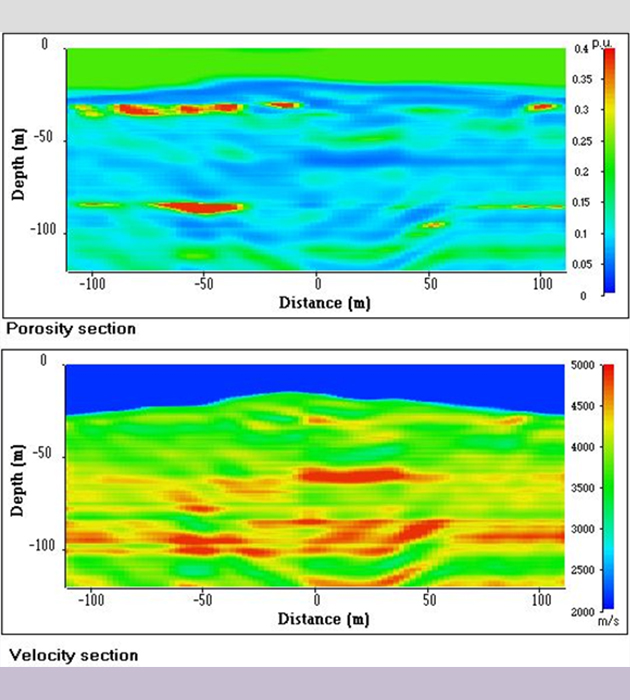
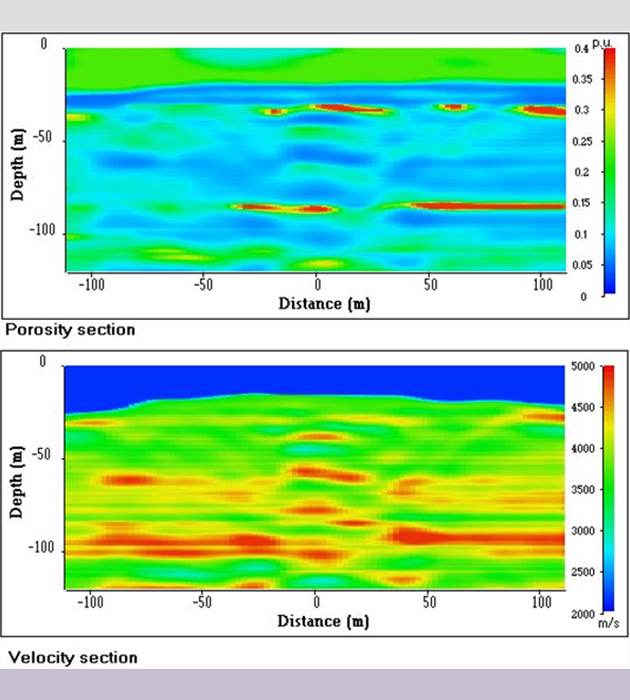
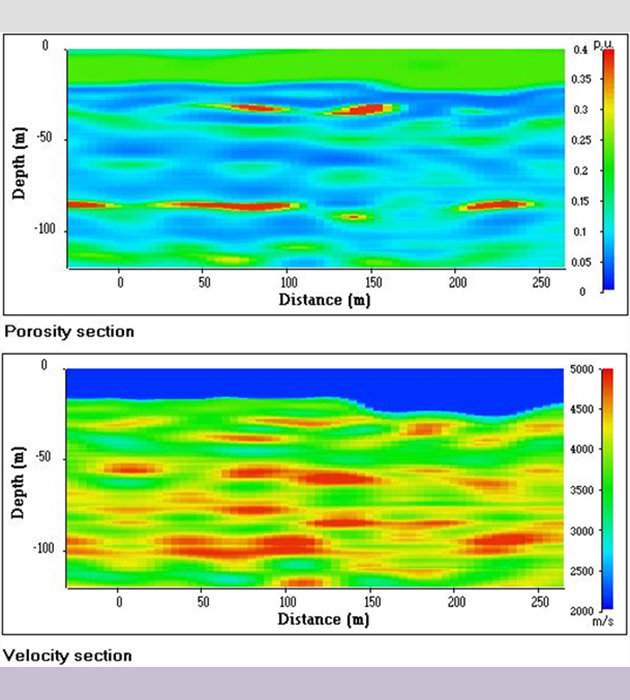
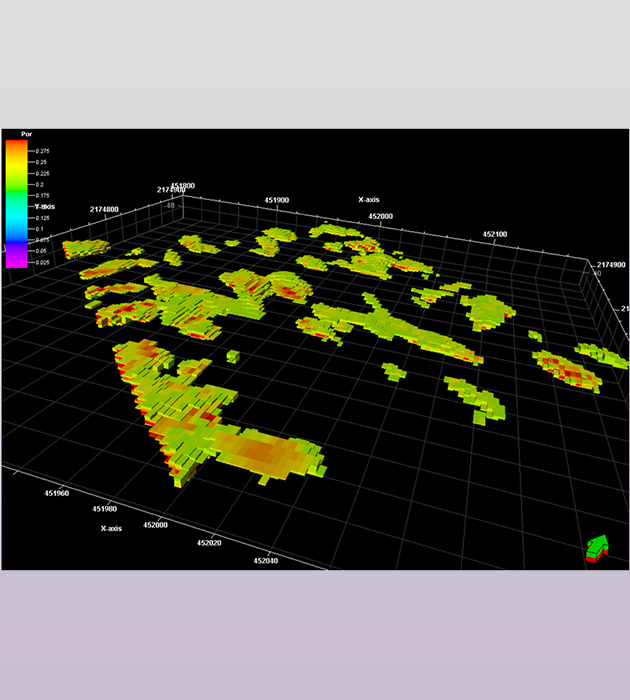
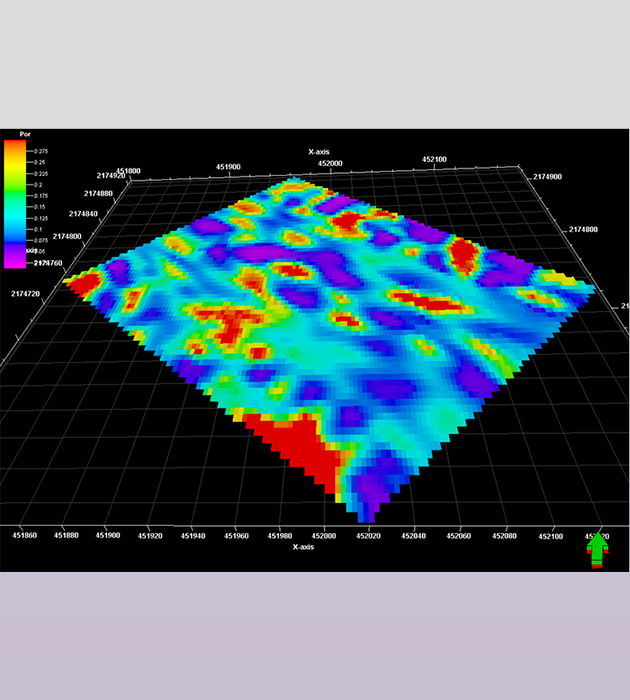
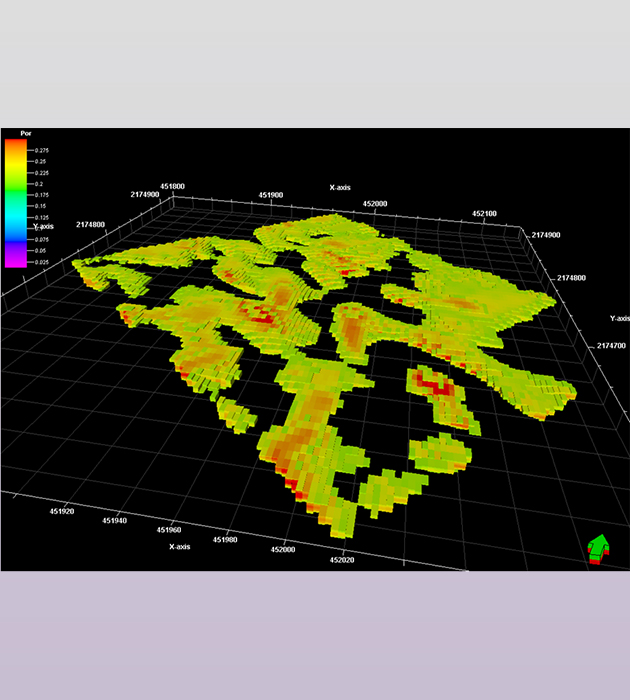
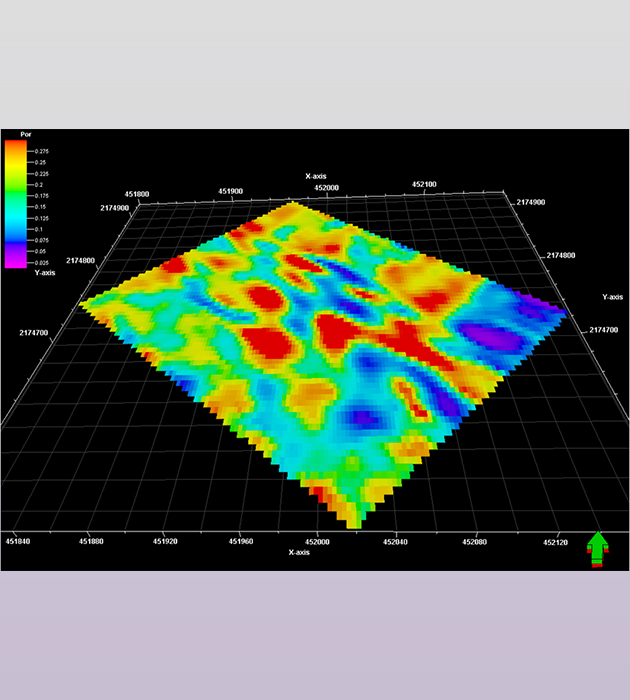
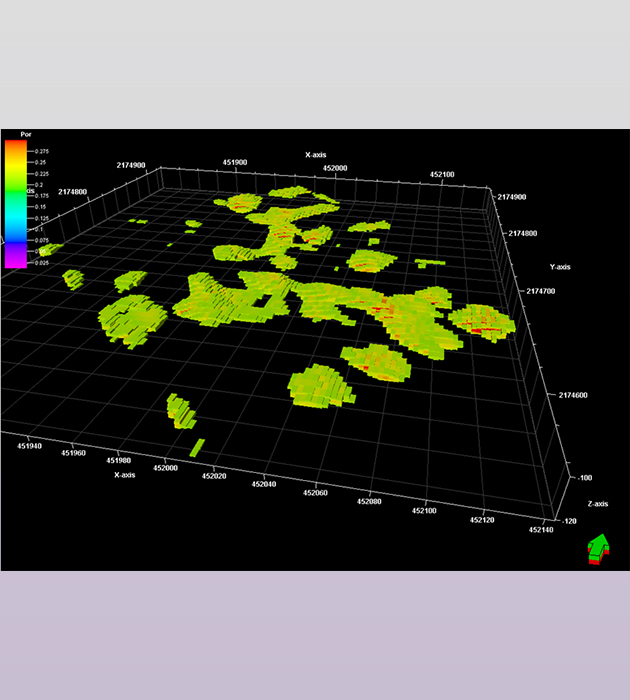
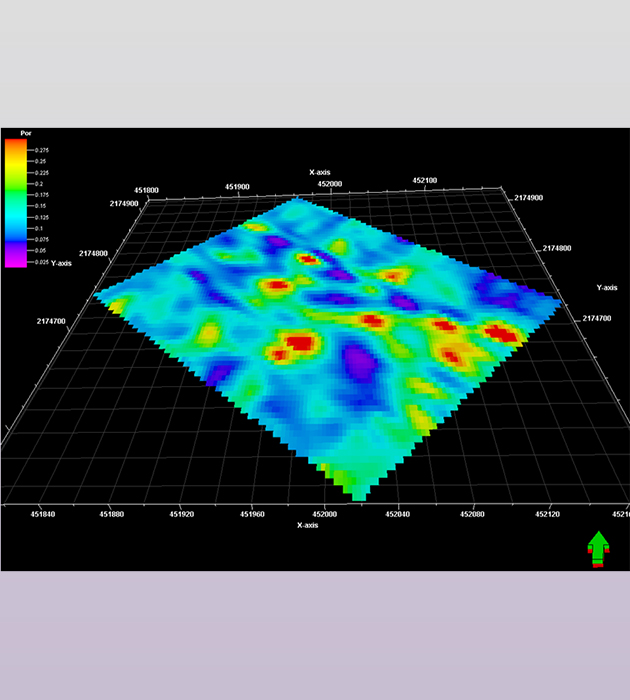
In order to quantify the porosity variations within that aquifer, the seismic-interval velocities were first converted into resistivity values. For that purpose, the empirical relationship between seismic velocity and true formation resistivity proposed by Faust was used. Resistivity values were then converted into porosity values, by using Archie's law. The resulting 3D seismic pseudo-porosity block revealed three high-porosity, presumably-water-productive, layers, at depths of 35-40, 85-87 and 110-115 m. The 85-87 m-depth layer is the most porous one, with bodies of a porosity higher than 30%, that represent the karstic part of the reservoir.
-
Step 1: In line 31 composite pseudo velocity and porosity seismic sections.
-
Step 2: In line 21 composite pseudo velocity and porosity seismic sections.
-
Step 3: Cross line 24 composite pseudo velocity and porosity seismic sections.
-
Step 4: Distribution of porous bodies in the 30 to 50 m depth interval.
-
Step 5: Porosity map at 35 m depth.
-
Step 6: Distribution of porous bodies in the 80 to 90 m depth interval.
-
Step 7: Porosity map at 85 m depth.
-
Step 8: Distribution of porous bodies in the 100 to 120 m depth interval.
-
Step 9: Porosity map at 115 m depth.
References
- Mari, J.L. and Porel, G. ,2007,. 3D seismic imaging of a near - surface heterogeneous aquifer: a case study, Oil and Gas Science and Technology, Rev IFP 63, 179-201. doi: 10.2516/ogst/2007077.
- Mari, J.L. and Delay F ,2011, Contribution of Seismic and acoustic methods to reservoir model building, in " Hydraulic Conductivity / Book 1", ISBN 978-953-307-288-3,InTech- Open Access Publisher,DOI: 10.5772/22051.
- Mari, J.L. and M. Mendes ,2012,. High resolution near surface imaging of fracture corridors and cavities by combining Plus Minus method and refraction tomography, Near Surface Geophysics, 10, 185-195, doi: 10.3997/1873-0604.201 1052.


