Update Required
To play the media you will need to either update your browser to a recent version or update your
Flash plugin.
Update Required
To play the media you will need to either update your browser to a recent version or update your
Flash plugin.
The example is a synthesis of the procedures developed to analyze acoustic data, ambient seismic noise, VSP data, BHTV and PLT log to detect karstic bodies and flows.
We consider the data recorded in well M20.
-
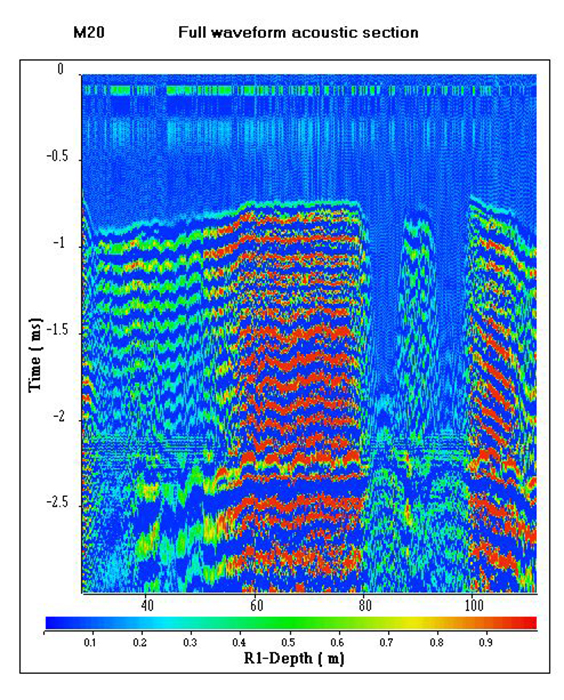
Step 1: Acoustic section.
On the 3 m constant-offset acoustic section, we see:
- the refracted P-waves between 0.5 and 1 milliseconds,
- locally the converted refracted shear waves between 1.2 and 1.8 milliseconds,
- the fluid waves characterized by very high frequencies of the order of 30 kHz,
- the Stoneley modes
On the acoustic section, we can see a strong attenuation of the refracted P-wave in two depth intervals between 82 and 88 meters and between 95 and 100 meters.
-
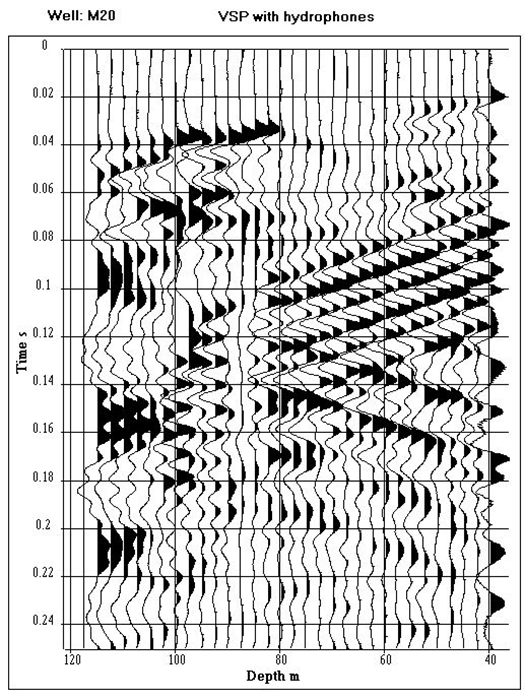
Step 2: VSP with hydrophones.
The VSP shows a down going Stoneley mode which is strongly attenuated at 82.5 m depth. We observe phenomena of conversion from downgoing P-wave to Stoneley waves between 82.5 and 100 m.
-
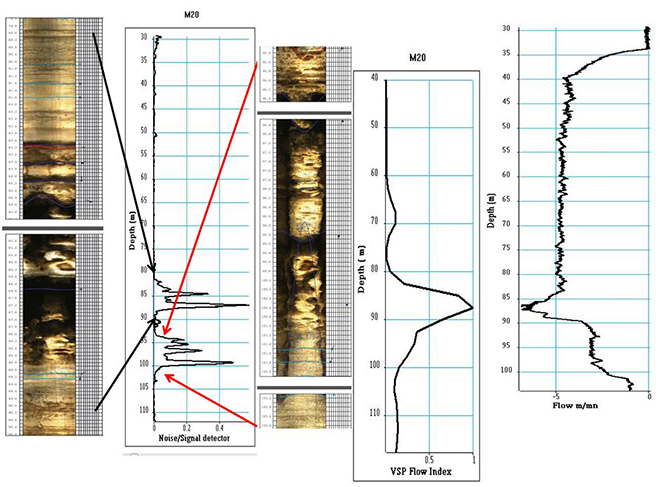
Step 3: A synthesis.
The analysis of the acoustic data and the computation of the Noise/signal detector have detected karstic levels in two depth intervals between 82 and 88 meters and between 95 and 100 meters.
The processing of VSP data and the analysis of the ambient noise confirm that the 82.5-100 m depth interval is a karstic layer and detect the presence of flow. A PLT log obtained during a pumping in well M04 validates the results of the acoustic- seismic experimentation.


