Update Required
To play the media you will need to either update your browser to a recent version or update your
Flash plugin.
Update Required
To play the media you will need to either update your browser to a recent version or update your
Flash plugin.
Acoustic logging is mainly used to provide the formation velocities by measuring the arrival time difference of the different wave trains at the various receivers of the tool, here R1 and R2 respectively at 3 m and 3.25 m from the acoustic source.
-
Step 1: P-wave velocity
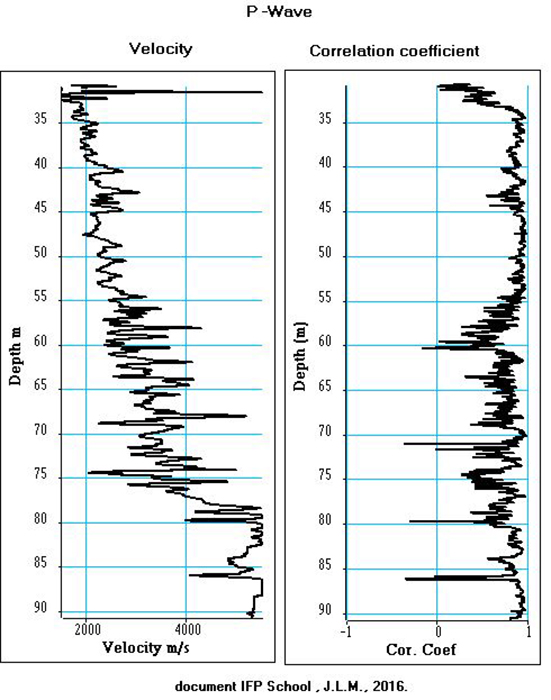
Left: P-wave velocity log computed from the time difference dt between the acoustic signals observed on the receivers R1 and R2,
Right: correlation log between the acoustic signals observed on the receivers R1 and R2, after compensation for δt. A high value of the correlation coefficient
indicates a strong similarity between the two signals and a good measure of the velocity. In this example, the correlation coefficient is greater than 0.75 for more
than 70% of the measured P-wave velocities. It is used to edit the log.
-
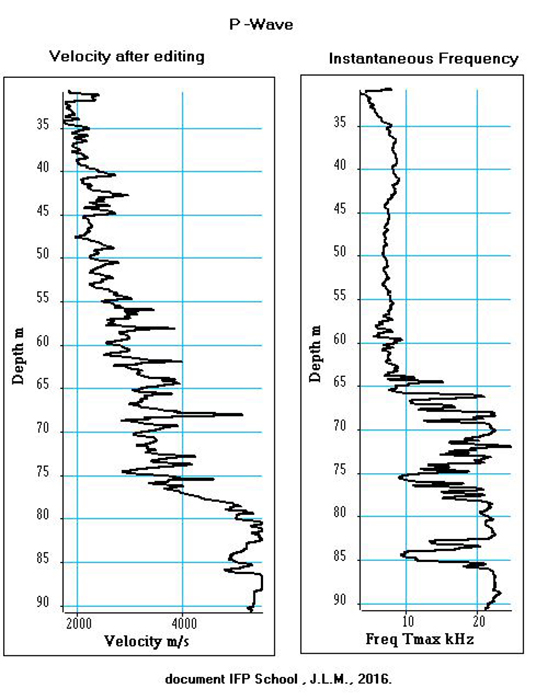
Step 2: P-wave velocity after editing and instantaneous frequency
The instantaneous frequency log shows very clearly the change in the frequency content of the acoustic signal at 65 m.
-
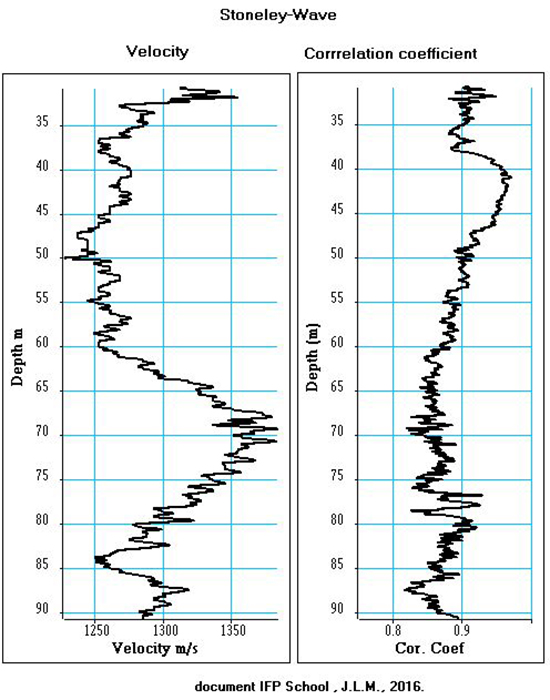
Step 3: Stoneley wave velocity log and its associated correlation coefficient log.
The very high values of the correlation coefficient (> 0.8) indicate that the measured velocity values are accurate
-
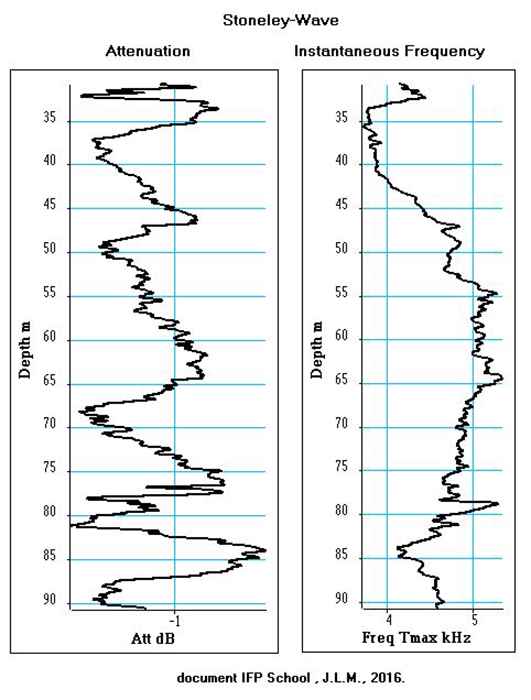
Step 4: Stoneley wave: Attenuation and frequency logs.
The attenuation log shows that these waves are not attenuated. These waves are sensitive to the borehole wall conditions and therefore to the presence of the casing.
It is interesting to use the information provided by Stoneley waves in an open hole to characterize the geological formation and in particular to detect the presence
of fractures. The frequency log shows that the Stoneley waves are dispersive and characterized by low frequencies (between 4 and 5 kHz)


