Chapter 2:
From Fundamental to Properties
Abstract
Read the abstractTable of contents
See the table of contentsList of examples
- 2.1: Refrigeration system
- 2.2: VLE observation
- 2.3: Flexfuel model
- 2.4: Phase envelope of a natural gas with retrograde condensation
- 2.5: Entropy rise in a ideal gas expansion
- 2.6: Cryogenic plant
- 2.7: Distillation column
- 2.8: Energy balance in a column feed
- 2.9: Risk of condensation of water in a gas stream
- 2.10: Effect of the feed composition on the water-gas shift reaction
- 2.11: Effect of temperature on the reaction constant
- 2.12: Chemical looping
Example 2.3: Flexfuel model
E85 gasoline may be represented in a simplified way using a mixture of isooctane for the hydrocarbon (15 % volume) and an ethanol-water mixture for the alcohol (85 % volume). For the sake of the example, we consider that the alcohol used for the mixing have been obtained by simple distillation: its composition in ethanol is very close to the binary azeotrope between water and ethanol. A 0.965 volume fraction composition will be used. The mixture is made at 298.15 K (25 °C) and the molar volumes are available at this temperature for each component.
- Locate this E85 gasoline on figure 1.
- In a distillery region, a driver adds 5 litres of a 70 % volume alcohol to the 25 litres of E85 in the car fuel tank. What happens? Has the climate an importance in the result of the mixing?
- To repair the "mistake", the driver decides to fill up the tank with only gasoline (isooctane) yet the flex motor is designed to work with any of these fuels. Suppose he fills the contaminated tank with 20 litres of C8H18. What happens? Is the phenomenon due to the "mistake"?
| Component | Molar mass (g/mol) | Molar density (mol/l) at 298.15 K |
|---|---|---|
| Isooctane | 114.2 | 6.0205 |
| Ethanol | 46.1 | 17.04 |
| Water | 18.0 | 55.384 |
Analysis:
Pressure and temperature are near ambient. Only compositions and phase behaviour are of interest. Components are hydrocarbon, alcohol and water. Water is known not to mix with hydrocarbons. Ethanol is a solvent for both other fluids. A two-phase liquid-liquid zone will be observed. The diagram is type I (drawn in figure 1).
Solution:
See complete results in file (xls):
Some help on nomenclature and tips to use this file can be found here.
First of all, equilibrium data are given in molar composition and gasoline measurements are made on a volume basis. Conversion must be carried out using molar volume.
Location of the point describing the E85 implies that its composition is known exactly. It is made from 15 % isooctane and 85 % of the ethanol-water mixture. If the "Ethanol" mixture contains 0.965 of pure ethanol then the net ethanol volume composition will be 0.82025. For the volume of 25 l, the number of moles and molar fractions are:
| Component | x (vol/vol) | Vol (l) | x (mol/mol) | moles |
|---|---|---|---|---|
| Isooctane | 0.15 | 3.75 | 0.0546 | 22.58 |
| Ethanol | 0.82025 | 20.51 | 0.8457 | 349.43 |
| Water | 0.02975 | 0.74 | 0.0997 | 41.19 |
| Total | 25.00 | 413.20 |
With 0.8457 molar fraction of ethanol in the mixture, The E85 is very near the top of the triangle (point A in figure 1). The water composition is almost on the 10 % isoline. This point belongs to the single-phase zone, so the fuel mix is OK.
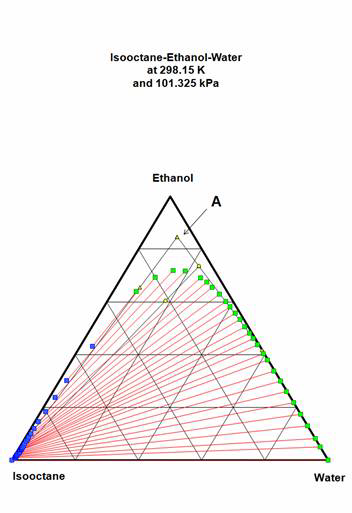 Figure 1: Original E85 composition in the ternary diagram
5 litres of raw alcohol from a retort is now added to the fuel. The same table starting with a volume composition of {0,0.7,0.3} is created. The mixture is obtained adding the moles of each component, resulting in table 3.
| Component | Vol (l) | x (vol/vol) | moles | x (mol/mol) |
|---|---|---|---|---|
| Isooctane | 3.75 | 0.125 | 22.58 | 0.0406 |
| Ethanol | 24.01 | 0.8002 | 409.07 | 0.7358 |
| Water | 2.24 | 0.0748 | 124.27 | 0.2235 |
| Total | 30.00 | 555.91 |
The resulting point is slightly below the former (point B on figure 2). On the 323.15 diagram, the point is still in the one-phase area, but on the 298.15 diagram the point is located very near the two-phase limit. If the temperature drops a few degrees, the liquid will split into two phases. It can be considered a dangerous mistake.
 Figure 2: First mixture {E85 composition + alcohol} in the ternary diagram at 323.15 and 298.15 K
Will adding 20 litres of pure isooctane correct this mistake? Another balance of the same kind is made to obtain:
| Component | Vol (l) | x (vol/vol) | moles | x (mol/mol) |
|---|---|---|---|---|
| Isooctane | 23.75 | 0.4750 | 142.99 | 0.2114 |
| Ethanol | 24.01 | 0.4801 | 409.07 | 0.6048 |
| Water | 2.25 | 0.0449 | 124.27 | 0.1837 |
| Total | 50.00 | 676.33 |
Now the mixture contains close to 60 % ethanol and a similar amount of water and isooctane. This point (C in figure 3) is located in the two-phase zone indicating a separation into two layers: at the bottom, the aqueous phase (with 66 % ethanol and 20 % water at 323.15 K) and an organic phase with very little ethanol and essentially isooctane on top.
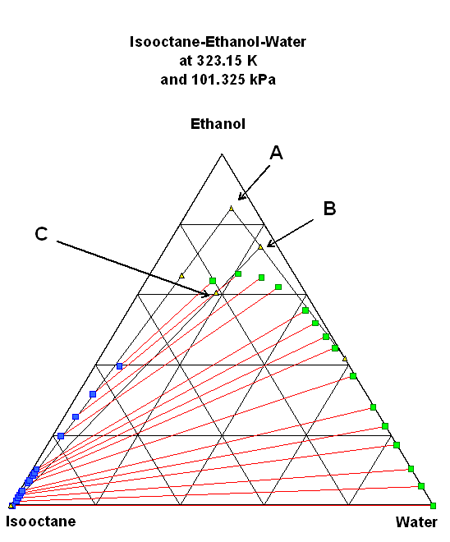 Figure 3: Second mixture {E85 composition + alcohol} in the ternary diagram
The cause is the excessive presence of water. Industrial E85 is made of very pure ethanol (99.8 % volume). Water is removed using a special dehydration column or molecular sieves. Check the result in this case.
Very similar behaviour would be observed filling directly isooctane (20 l) on the raw E85 (5 l). The composition is given by point D on figure 4.
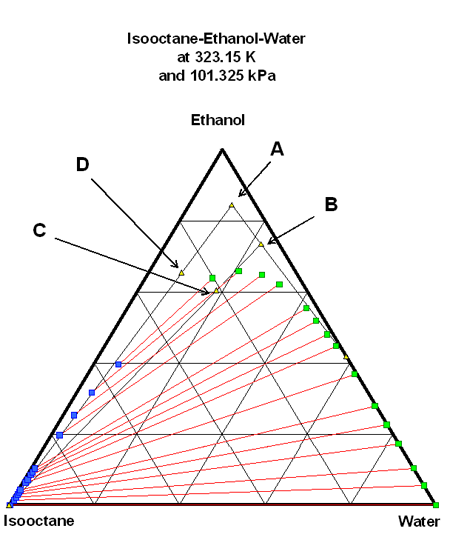 Figure 4: Mixture {E85 composition + pure isooctane} in the ternary diagram