Chapter 3:
From Components
to Models
Abstract
Read the abstractTable of contents
See the table of contentsList of examples
- 3-1: Vapour pressure predictions of methane using different formulas
- 3-2: Quality evaluation of molar volume correlations
- 3-3: Evaluation of the ideal gas heat capacity equations for n-pentane
- 3-4: Quality evaluation of vapourisation enthalpy correlations
- 3-5: Comparison of second virial coefficient calculation methods
- 3-6: Comparison of critical points and acentric factor from different databases
- 3-7: Use of the group contribution methods of Joback and Gani
- 3.8: Diesel fuel characterization
- 3.9: Vapour pressures of di-alcohols
- 3.10: Find the parameters to fit the vapour pressure of ethyl oleate
- 3.11: Fitting of BIP coefficients for the mixture water + MEA with the NRTL model
- 3.12: Separation of n-butane from 1,3 butadiene at 333.15K using vapour-liquid equilibrium
- 3.13: Draw the heteroazeotropic isothermal phase diagram of the binary mixture of water and butanol at 373.15 K
- 3.14: Isothermal phase diagram using the Flory Huggins activity coefficient model
- 3.15: Use of an equation of state for pure component vapour pressure calculations
Example 3-9: Vapour pressures of di-alcohols
When comparing the vapour pressures of di-alcohols using DIPPR[1], figure 1 is found. It is expected that the lightest component has the highest vapour pressure, and the heaviest component the lowest. Yet, the graph shows that curves that cross each other, clearly indicating that something is wrong.
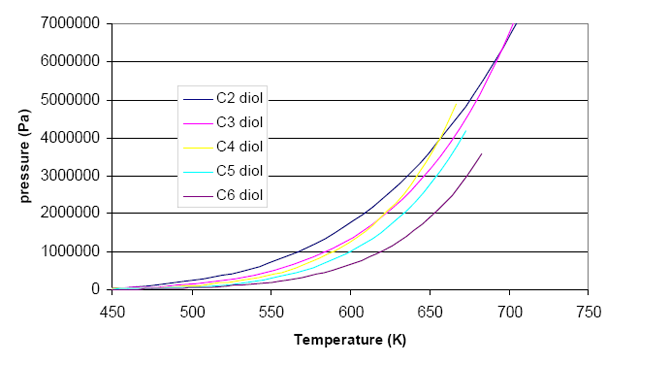 Figure 1: Vapour pressure behaviour of the series of diols where the hydroxyl groups are at the end of the chain.
Analysis:
In order to analyze the data, the Clapeyron equation is used: two pieces of information are required in order to fully define the Clapeyron straight line. For example, we can choose normal boiling temperature (one point) and enthalpy of vaporization at this temperature (slope). Doing so, each component is represented by a point on figure 2. For each component, the vaporization enthalpy can be obtained, either using the recommended value from DIPPR, or using the slope of the vapour pressure curve at the normal boiling temperature. These two values do not coincide. Whenever possible, an additional source of data (here CRC) was used
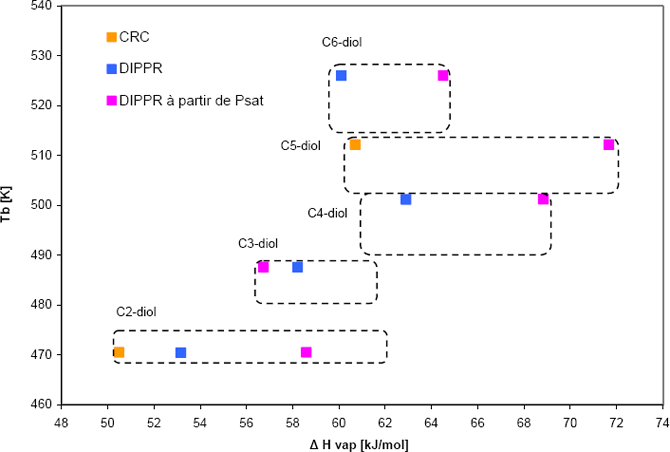 Figure 2: Vapour pressure behaviour of the series of diols where the alcohols is at the end of the chain.
Solution:
The plot clearly shows that the data do not follow a regular trend, as it should be expected. Therefore, it is highly recommended to collect new experimental information.
References
[1] R. L. Rowley, W. V. Wilding, J. L. Oscarson, Y. Yang, N. A. Zundel, T. E. Daubert, R. P. Danner, DIPPR® Data Compilation of Pure Compound Properties, Design Institute for Physical Properties, AIChE, New York, NY (2003).
Ref Type: Grant