Chapter 3:
From Components
to Models
Abstract
Read the abstractTable of contents
See the table of contentsList of examples
- 3-1: Vapour pressure predictions of methane using different formulas
- 3-2: Quality evaluation of molar volume correlations
- 3-3: Evaluation of the ideal gas heat capacity equations for n-pentane
- 3-4: Quality evaluation of vapourisation enthalpy correlations
- 3-5: Comparison of second virial coefficient calculation methods
- 3-6: Comparison of critical points and acentric factor from different databases
- 3-7: Use of the group contribution methods of Joback and Gani
- 3.8: Diesel fuel characterization
- 3.9: Vapour pressures of di-alcohols
- 3.10: Find the parameters to fit the vapour pressure of ethyl oleate
- 3.11: Fitting of BIP coefficients for the mixture water + MEA with the NRTL model
- 3.12: Separation of n-butane from 1,3 butadiene at 333.15K using vapour-liquid equilibrium
- 3.13: Draw the heteroazeotropic isothermal phase diagram of the binary mixture of water and butanol at 373.15 K
- 3.14: Isothermal phase diagram using the Flory Huggins activity coefficient model
- 3.15: Use of an equation of state for pure component vapour pressure calculations
Example 3-2: Quality evaluation of molar volume correlations
A comparison of liquid molar volume for various hydrocarbons is to be proposed. Differences between the DIPPR correlation and the Racket prediction will be analysed. Parameter values for the different components are found in the following table:
| Component | Tc(K) | Pc (kPa) | ω | A | B | C | D |
|---|---|---|---|---|---|---|---|
| Ethane | 305.32 | 4872 | 0.099493 | 1.9122 | 0.27937 | 305.32 | 0.29187 |
| n-Hexane | 507.6 | 3025 | 0.301261 | 0.70824 | 0.26411 | 507.6 | 0.27537 |
| Cyclohexane | 553.8 | 4080 | 0.208054 | 0.88998 | 0.27376 | 553.8 | 0.28571 |
| Benzene | 562.05 | 4895 | 0.2103 | 1.0259 | 0.26666 | 562.05 | 0.28394 |
| n-Decane | 617.7 | 2110 | 0.492328 | 0.41084 | 0.25175 | 617.7 | 0.28571 |
The Rackett and DIPR equations for liquid molar volume are given (see chapter 3, section 1.1.2.4):
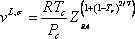
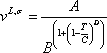
ZRa is calculated using equation (3):

Analysis:
- The property given is temperature, or preferably a range of temperatures on the saturation curve.
- Components are all hydrocarbons of different molar mass and different families.
- The phase of interest is liquid along the saturation curve.
Model requirement:
Two different correlations are compared: the DIPPR correlation and the Rackett prediction. The relative deviation between the Rackett equation and the DIPPR saturated liquid volume correlation has been evaluated for a number of hydrocarbons.
Solution:
See complete results in file (xls):
Some help on nomenclature and tips to use this file can be found here.
The typical uncertainty on volume measurements is close to 3%. We can therefore can conclude that, especially for light hydrocarbons, the Rackett equation is very useful. The deviation is larger for heavier hydrocarbons. The equation is not suitable for non-hydrocarbons. If the calculation is carried out with the optimised value of ZRa, the error is less than 1%.
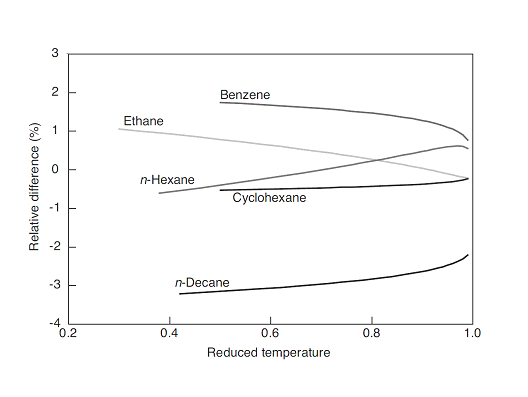 Figure 1: Evaluation of the Rackett equation with respect to the DIPPR correlations.
It is very easy to implement a short enhancement to the formula using an optimized value of ZRA. In the file, a choice can be made between two different values using a 1 or 0 value in cell B15 (remember that the values in blue are the values introduced by user). You can change this cell to 0 and then optimize the value in violet to minimize the RMSE (in brown).
References
R. L. Rowley, W. V. Wilding, J. L. Oscarson, Y. Yang, N. A. Zundel, T. E. Daubert, R. P. Danner, DIPPR® Data Compilation of Pure Compound Properties, Design Institute for Physical Properties, AIChE, New York, NY (2003).